Custom modeling objective metric views(自定义建模目标指标视图(Custom modeling objective metric views))
One key functionality of a modeling objective is the ability to inspect an individual model's performance on a particular dataset, while also being able to compare those same performance metrics on that same data across different models. It is able to do this by leveraging the metric set and input dataset relationship across model submissions.
This tutorial assumes you already know how to create metric sets with subsets and have already configured automatic model evaluation.
Once you have followed the steps on this page to customize metric views, you can use them in the evaluation dashboard to compare the performance of multiple models. Note that these tabs will not be displayed on the evaluation dashboard unless the advanced setting show pinned tabs in evaluation dashboard is enabled.
Getting started
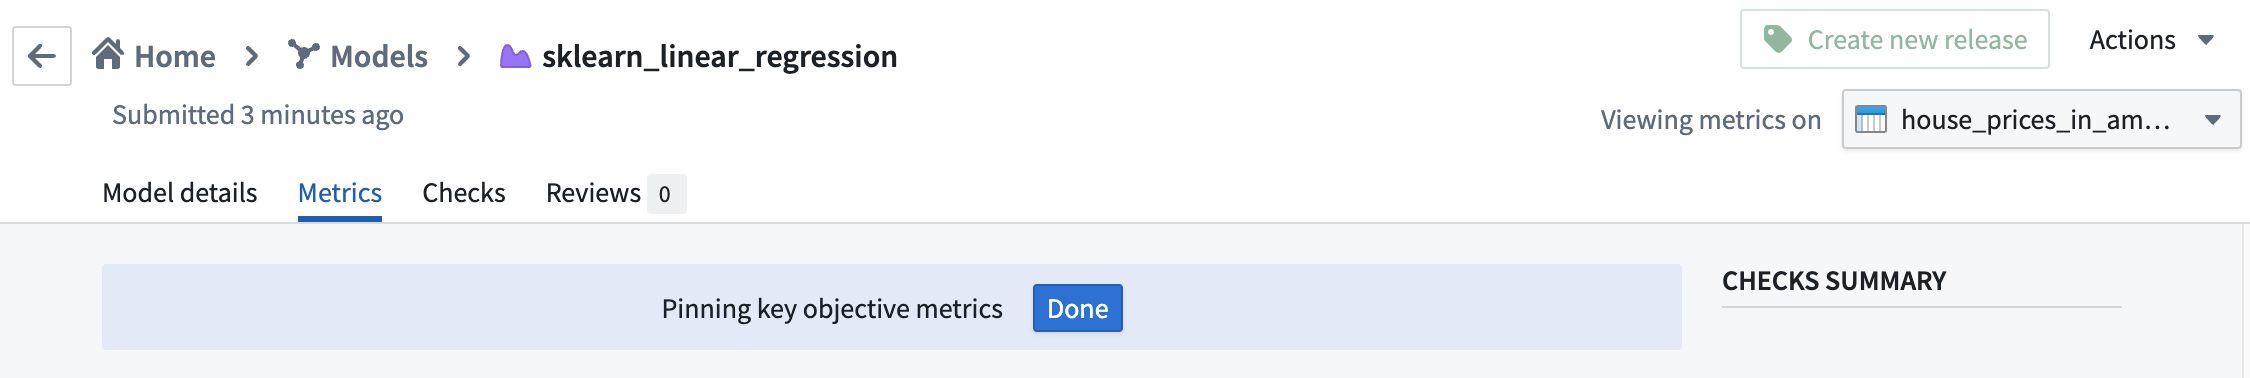
Click on a model submission name to navigate to its individual page. This view is highly customizable depending on the metrics, charts, or images attached to the individual model submissions in the evaluation configuration or in code.
The configuration options available are: pinning metrics, creating tabs, and building charts. The goal of these options is to communicate and categorize information to share across all model submissions and highlight important performance metrics to be compared.
:::callout{theme="neutral"} Information configured on one submission's view (i.e custom tabs created or metrics pinned) will also appear as configured for every other submission. Configuration is done on the modeling objective level, not the individual submission level, to create a global dialog for all model submissions. :::
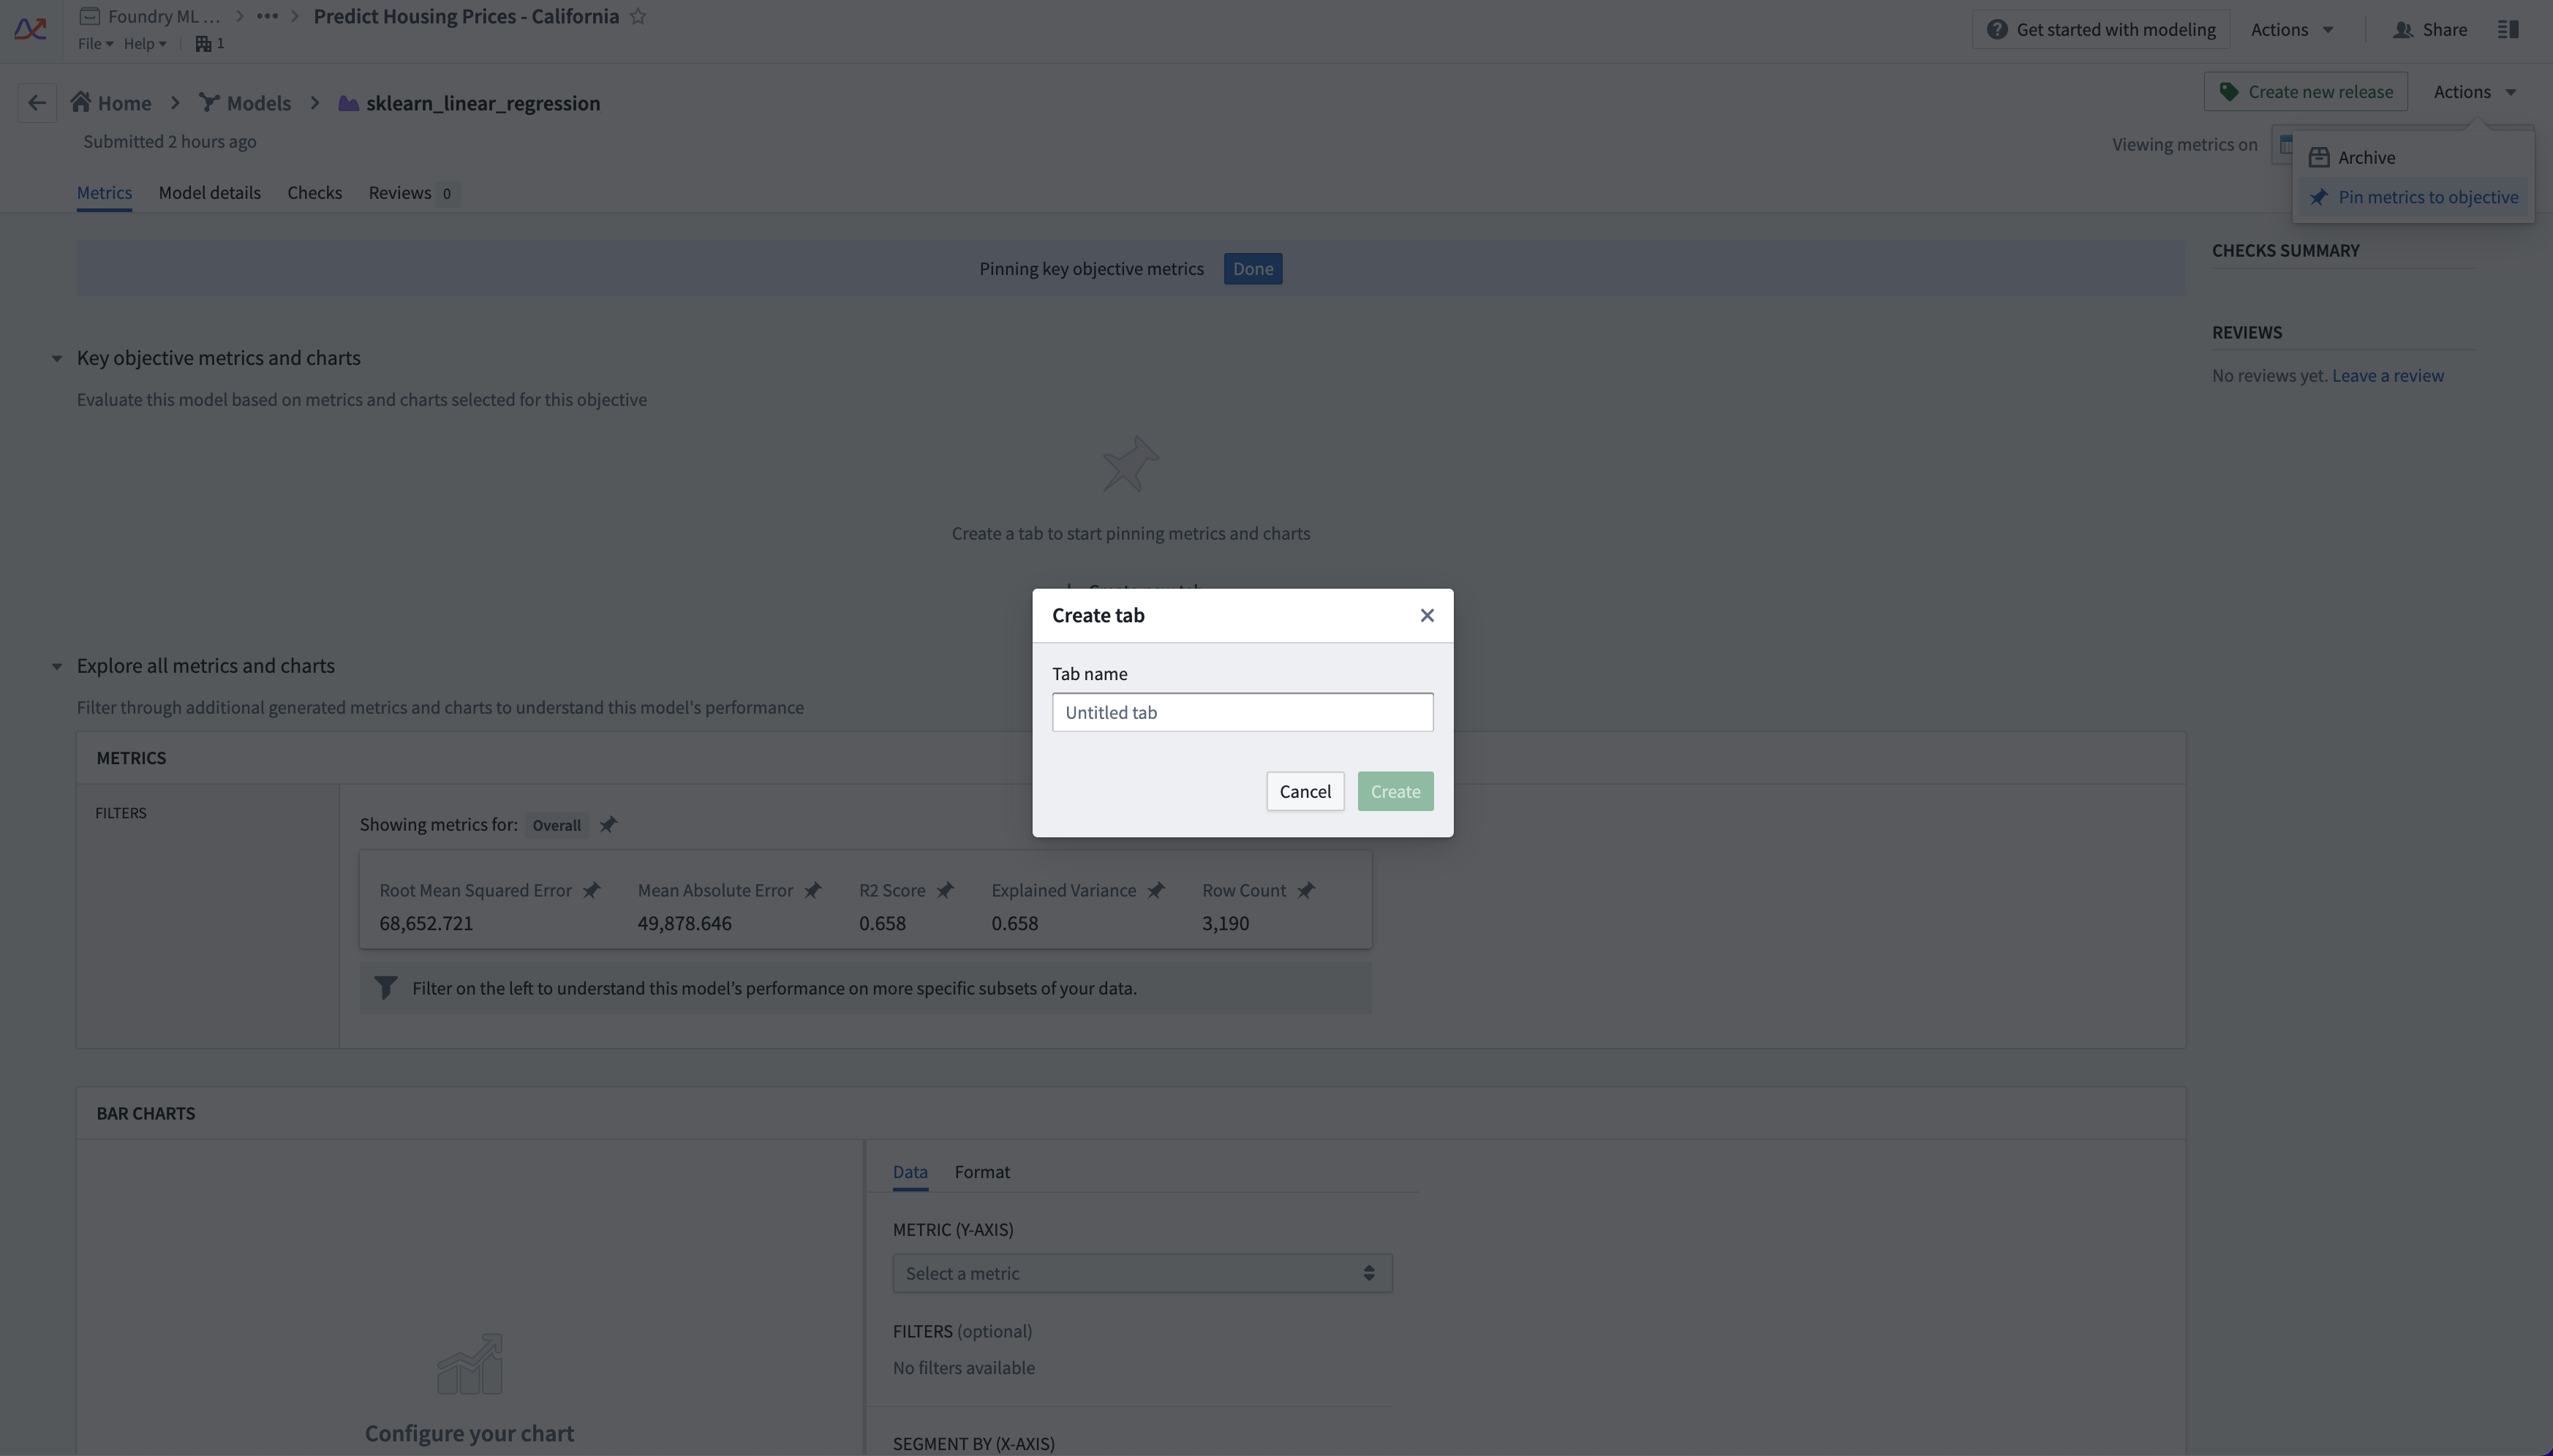
To edit metric views, select the Actions tab on the top right of the page. You will see a number of options depending on your level of access to the objective. Select Pin metrics to objective. Pin icons will appear on all the metrics and charts, and a blue bar at the top of the interface will indicate that you are in edit mode.
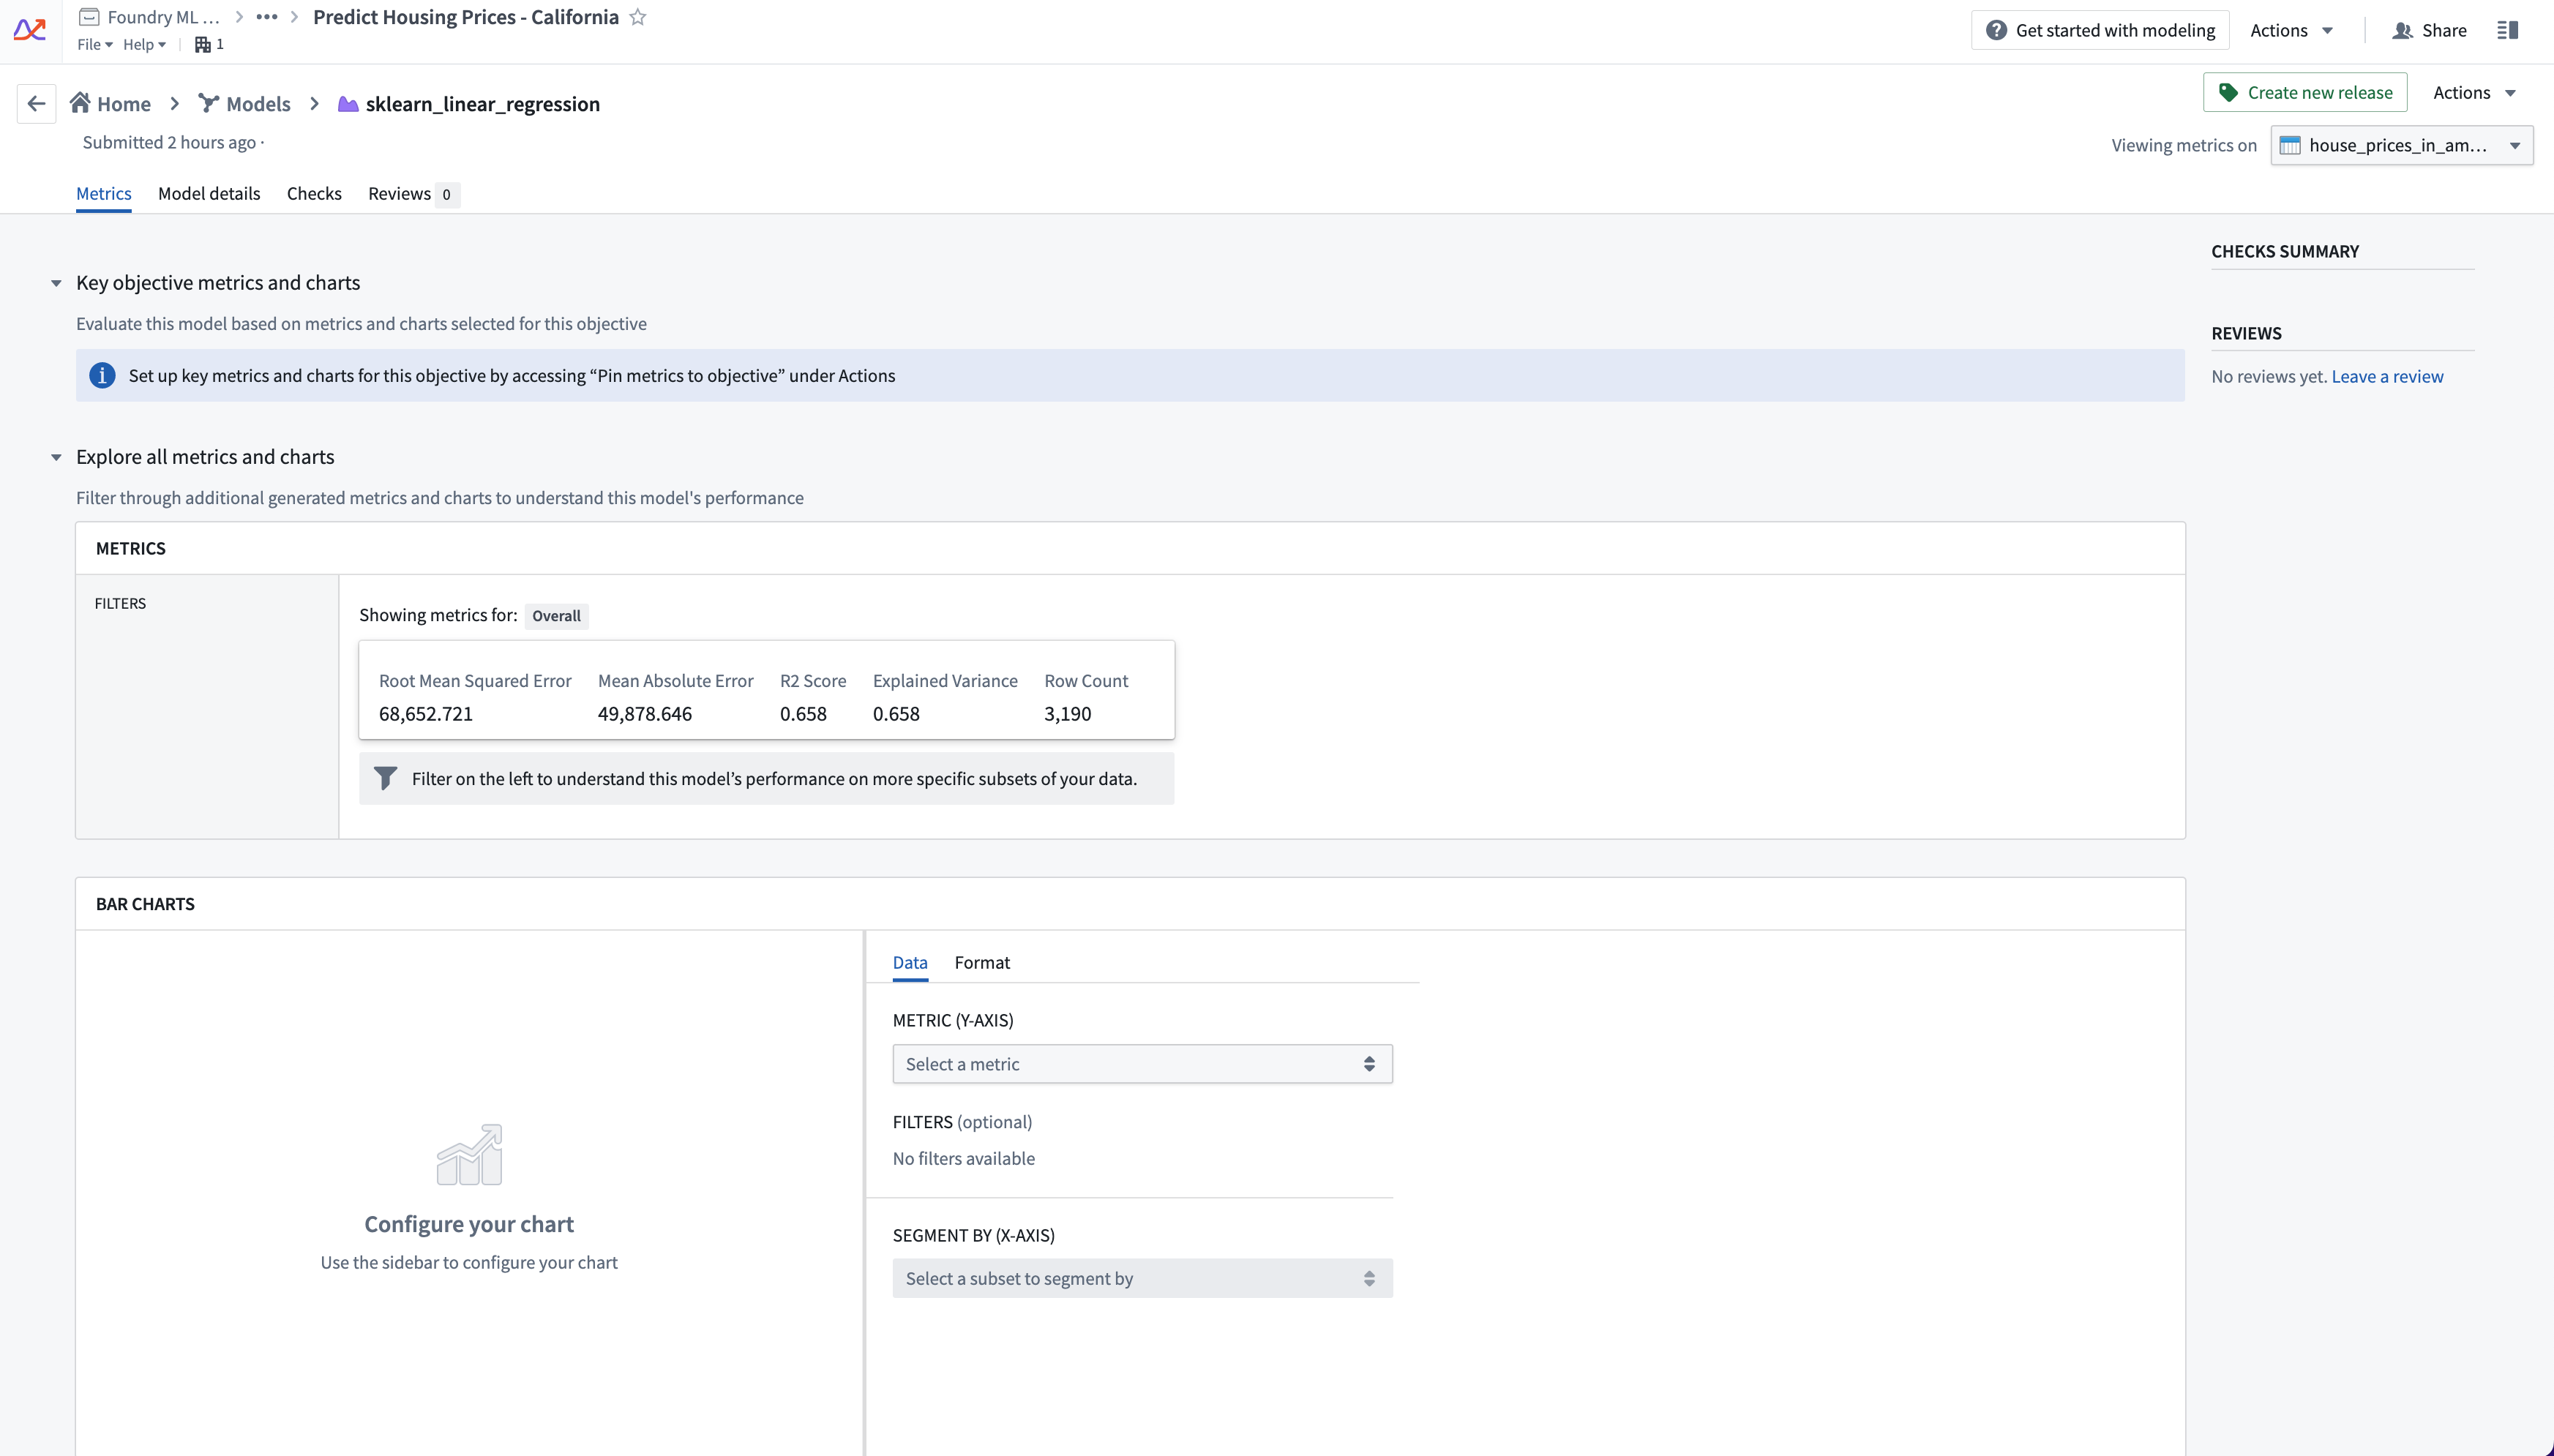
As a reminder, the metrics that appear in the Explore all metrics and charts section are dependent on the evaluation dataset and transaction that is selected in the top right.
Creating tabs and pinning metrics
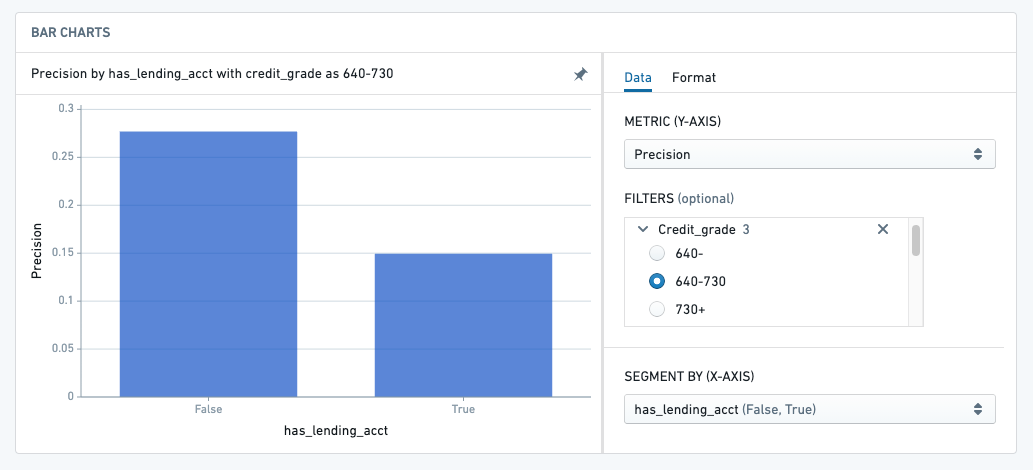
Tabs help organize metrics and charts into meaningful views, which may pertain to different evaluation facets or stakeholders. For example, as in the notional example shown below, a financial modeling group may want to surface metrics broken out by sensitive features.
Under the section Key objective metrics and charts select the + Create new tab option. A dialog will appear giving you the option to name the tab.
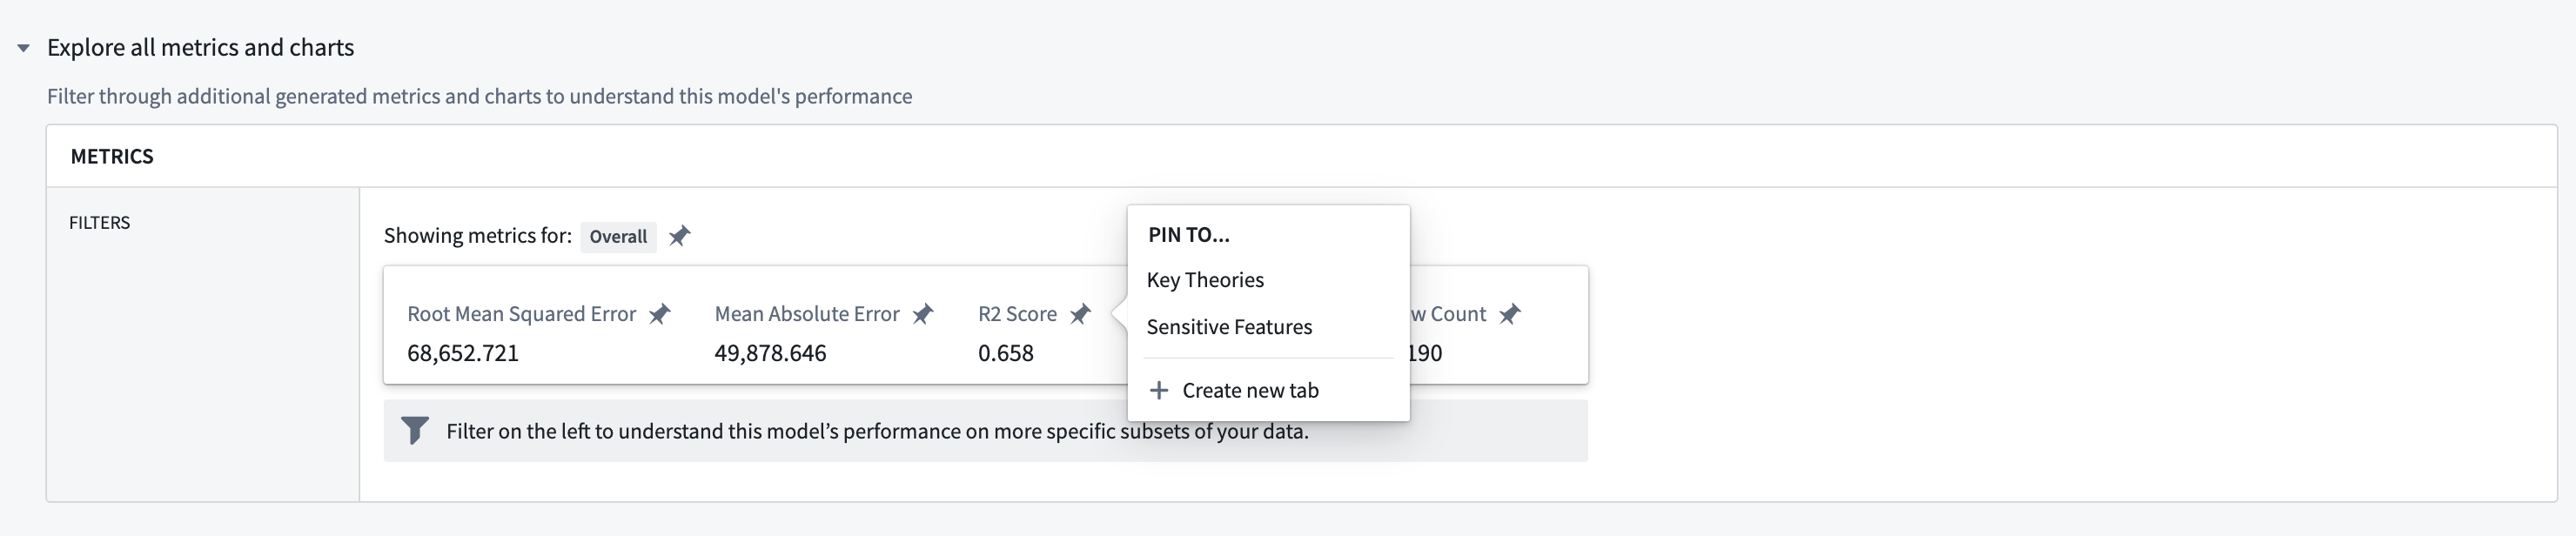
Once you have created a tab, scroll through the metric explorer and charts below and pin statistics, charts, or images by clicking on the pin icon. Any subsets will also be available in the metric explorer automatically.
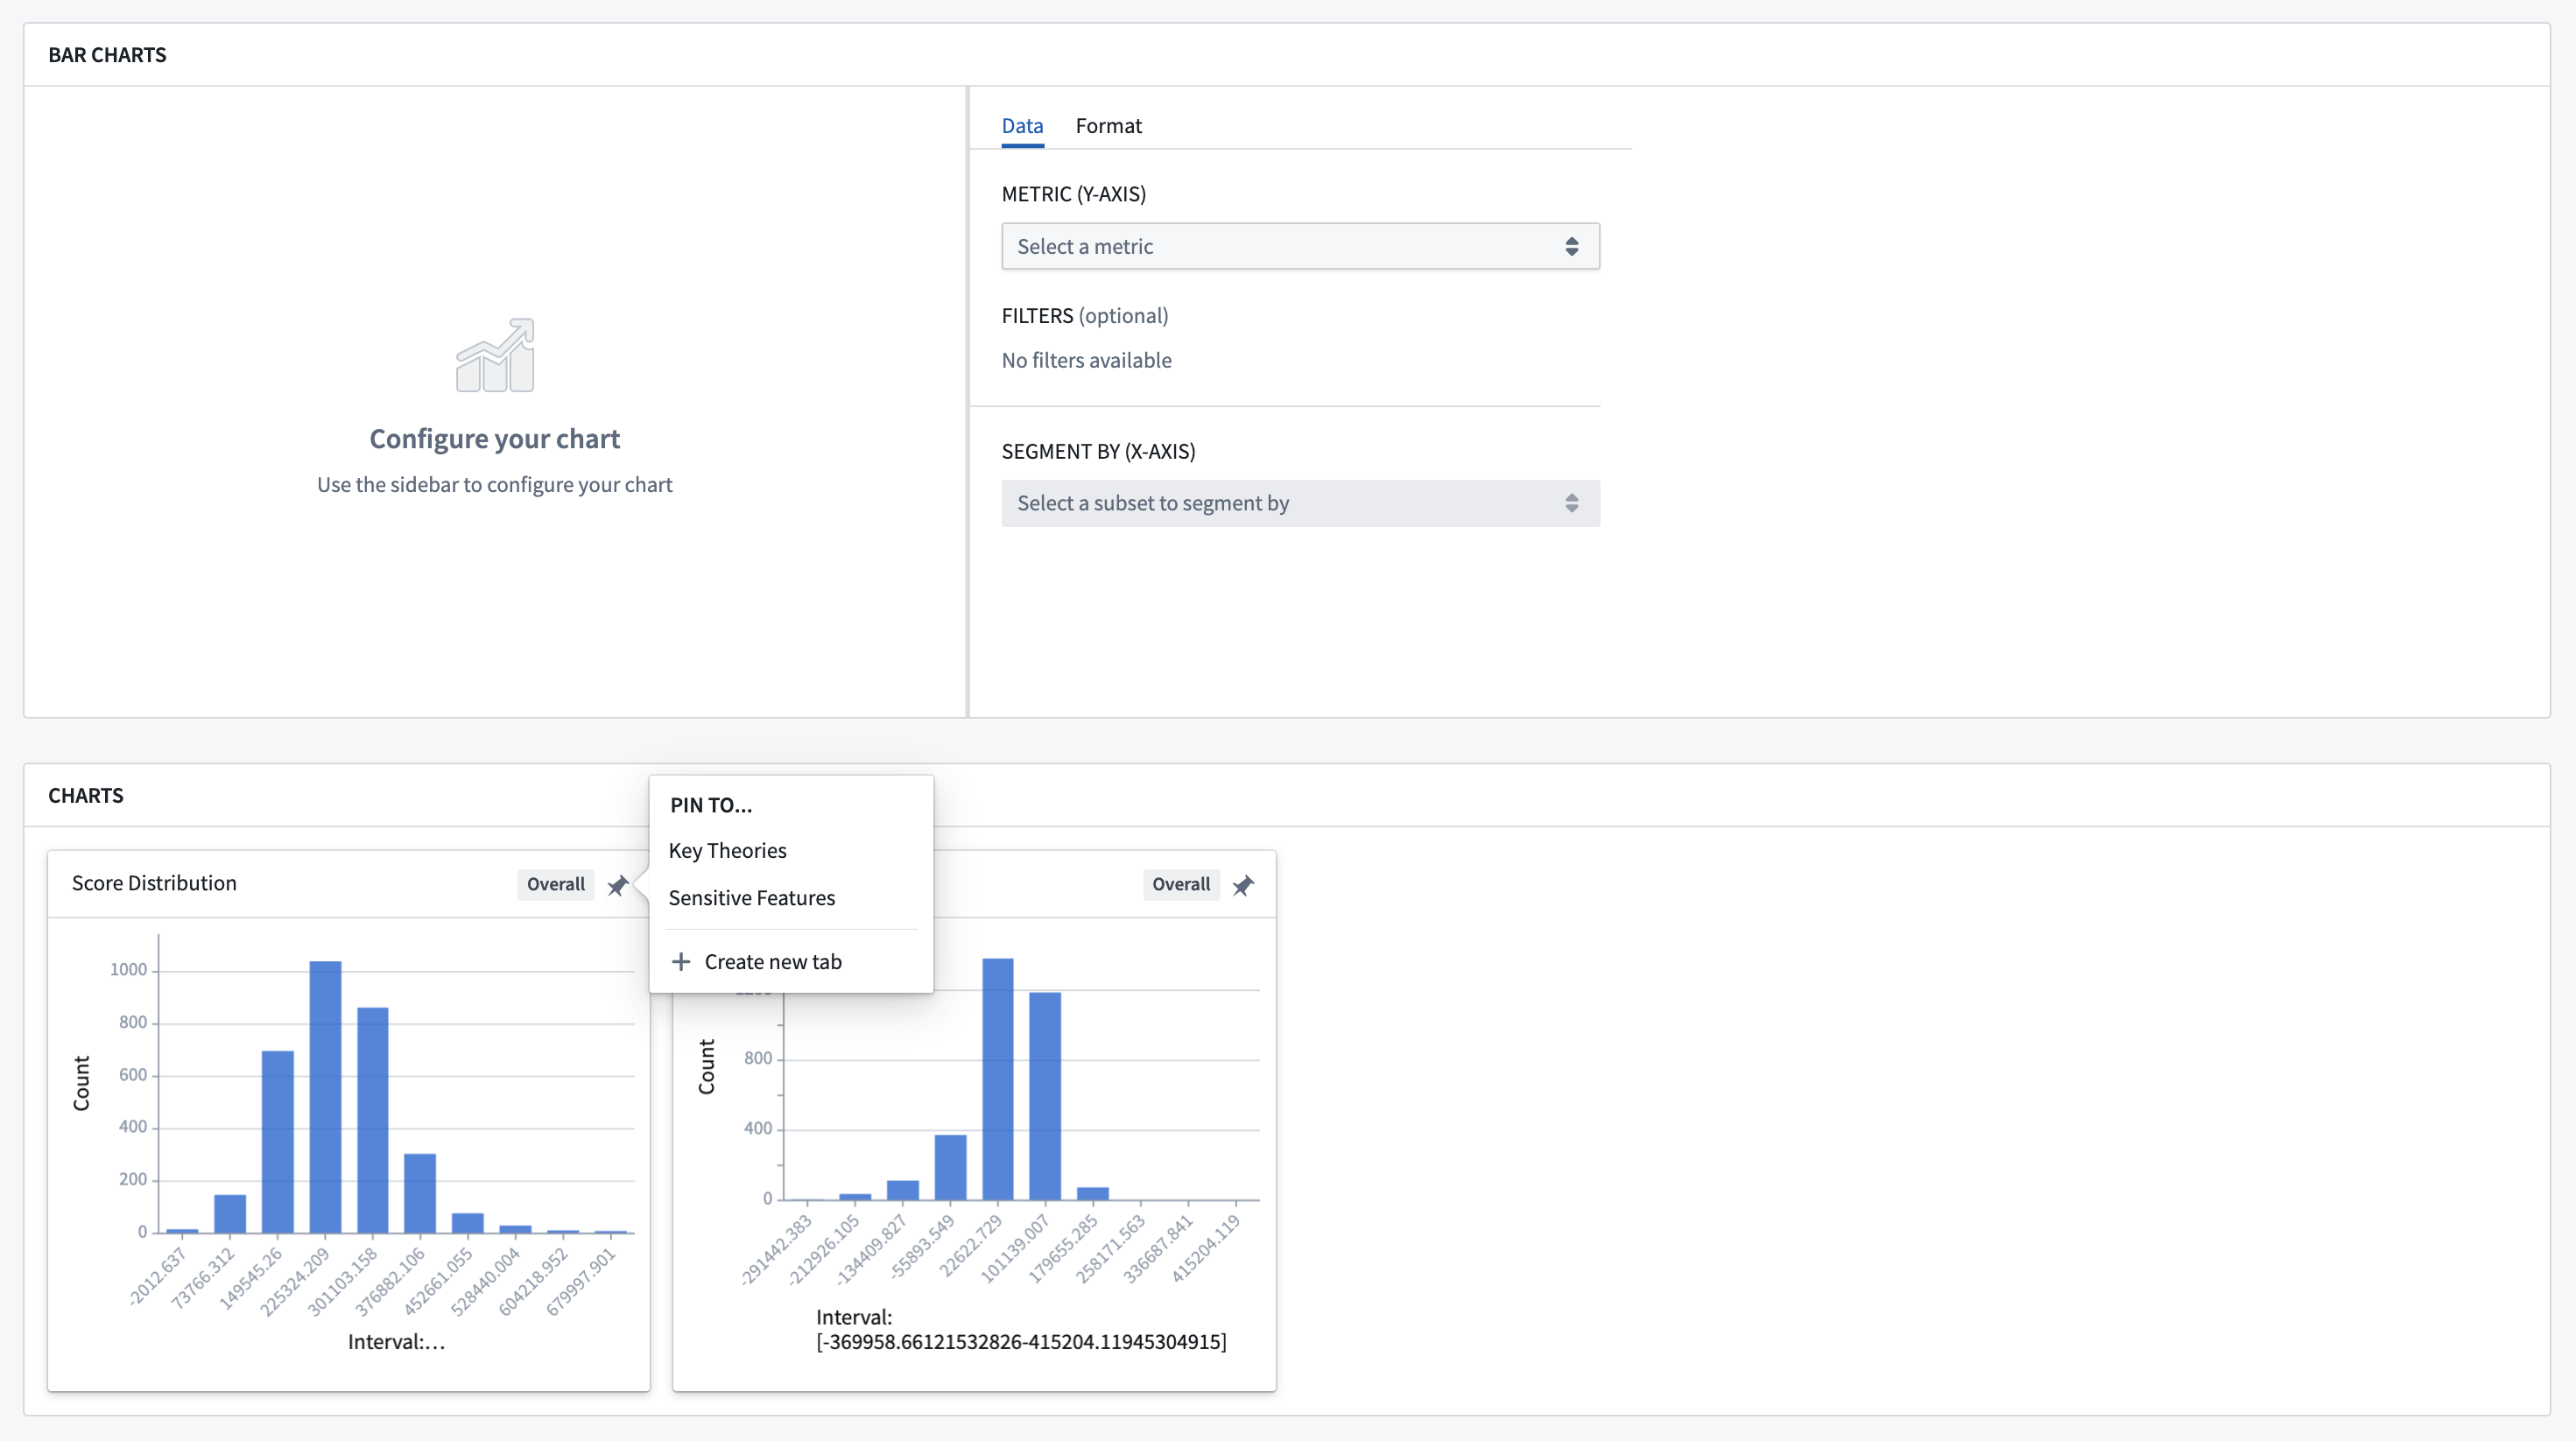
You can create interactive bar charts based on the metrics that are available in the metric explorer, and pin them to the tab as well.
The metrics that are pinned and the tabs that are created are not meant to be static. Configurations should evolve as new data comes in, new feedback is received, and new theories are tested.
Common patterns for tab categories are "Key Metrics/Theories", "Sensitive Features", and "Outlier Information".
When you're satisfied with your configuration across your Input Datasets, select the Done button at the top of the page.
中文翻译
自定义建模目标指标视图(Custom modeling objective metric views)
建模目标(modeling objective)的一项关键功能是,既能检查单个模型在特定数据集上的性能,又能比较不同模型在同一数据上的相同性能指标。它通过利用指标集(metric set)和输入数据集(input dataset)在模型提交(model submission)之间的关联关系来实现这一点。
本教程假设您已经知道如何使用subsets创建指标集,并且已经配置了自动模型评估(automatic model evaluation)。
按照本页步骤自定义指标视图后,您可以在评估仪表板(evaluation dashboard)中使用它们来比较多个模型的性能。请注意,除非启用了高级设置在评估仪表板中显示固定标签(show pinned tabs in evaluation dashboard),否则这些标签不会显示在评估仪表板上。
开始使用
点击模型提交名称,导航至其独立页面。此视图高度可定制,具体取决于评估配置或代码中附加到单个模型提交的指标、图表或图像。
可用的配置选项包括:固定指标(pinning metrics)、创建标签(creating tabs)和构建图表(building charts)。这些选项的目标是传达和分类信息,以便在所有模型提交之间共享,并突出显示需要比较的重要性能指标。
:::callout{theme="neutral"} 在一个提交视图上配置的信息(例如创建的自定义标签或固定的指标)也会出现在其他所有提交的视图中。配置是在建模目标级别完成的,而非单个提交级别,以便为所有模型提交创建一个全局对话。 :::
要编辑指标视图,请选择页面右上角的操作(Actions)标签。根据您对目标的访问权限,您会看到多个选项。选择将指标固定到目标(Pin metrics to objective)。所有指标和图表上都会出现固定图标,界面顶部的蓝色条会提示您已进入编辑模式。
提醒一下,探索所有指标和图表(Explore all metrics and charts)部分中显示的指标取决于右上角选择的评估数据集(evaluation dataset)和事务(transaction)。
创建标签和固定指标
标签有助于将指标和图表组织成有意义的视图,这些视图可能涉及不同的评估方面或利益相关者。例如,如下方示例所示,金融建模团队可能希望按敏感特征(sensitive features)分类展示指标。
在关键目标指标和图表(Key objective metrics and charts)部分下,选择+ 创建新标签(+ Create new tab)选项。将出现一个对话框,让您为标签命名。
创建标签后,滚动下方的指标探索器和图表,通过点击固定图标来固定统计信息、图表或图像。任何subsets也会自动出现在指标探索器中。
您可以根据指标探索器中可用的指标创建交互式柱状图,并将其固定到标签上。
固定的指标和创建的标签并非一成不变。随着新数据的到来、新反馈的接收以及新理论的测试,配置应不断演进。
标签类别的常见模式包括"关键指标/理论(Key Metrics/Theories)"、"敏感特征(Sensitive Features)"和"异常信息(Outlier Information)"。
当您对输入数据集(Input Datasets)的配置感到满意时,请点击页面顶部的完成(Done)按钮。