Regression evaluator(回归评估器(Regression evaluator))
One of the default evaluation libraries in a modeling objective is the Regression evaluator. This library provides a core set of metrics commonly used to evaluate regression models.
Included metrics
:::callout{theme="neutral"} The below metrics are produced for every subset bucket configured in the evaluation dashboard. :::
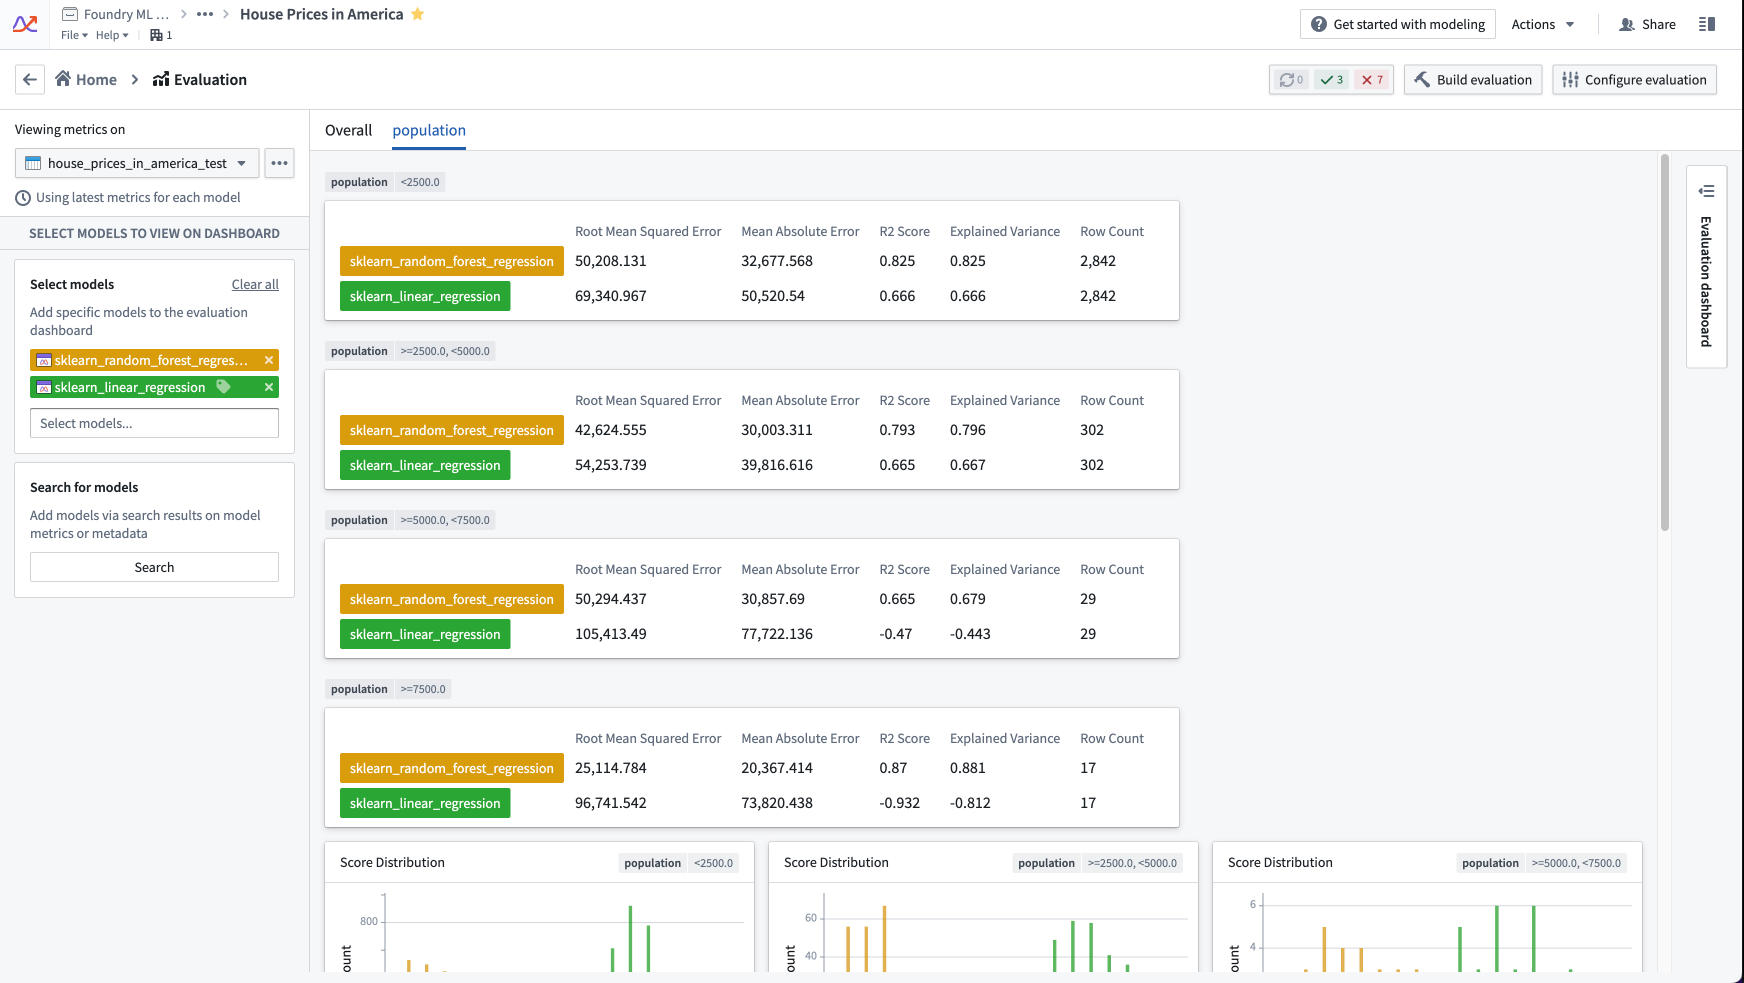
The default regression evaluator produces the following numeric metrics:
- Row Count: The number of records in the evaluation dataset.
- Mean Absolute Error: The average error (difference) between the label data and the model prediction, regardless of the direction of error. The value is always positive and approaches 0 as a model performs better on the evaluation dataset.
- Root Mean Squared Error: Similar to mean absolute error, the root mean squared error also represents a difference between the label data and the model prediction, ignoring the direction of error. The root mean squared error, however, gives more weight to predictions that are further away from the label data. This value is always positive and approaches 0 as a model performs better on the evaluation dataset.
- R2 Score: The R2 (R squared) score represents the proportion of variance in the label data that is explained by the model. This value is always less than or equal to 1, and a score closer to 1 represents a model that performs better against the evaluation dataset. The R2 score can be negative.
- Explained Variance: Similar to the R2 score, this represents the proportion of variance in the label data that is explained by the model predictions. Explained variance differs from the R2 score when the average error is non-zero; this difference indicates model bias. This value is always less than or equal to 1, and a score closer to 1 represents a model that performs better against the evaluation dataset. The explained variance can be negative.
The default regression evaluator produces the following plots:
- Score distribution: Chart showing the distribution of model predictions on the evaluation dataset.
- Residuals: Chart showing the distribution of residuals on the evaluation dataset, where a residual is the
label_value - prediction.
Configuration
For full configuration instructions, see the documentation on how to configure a model evaluation library.
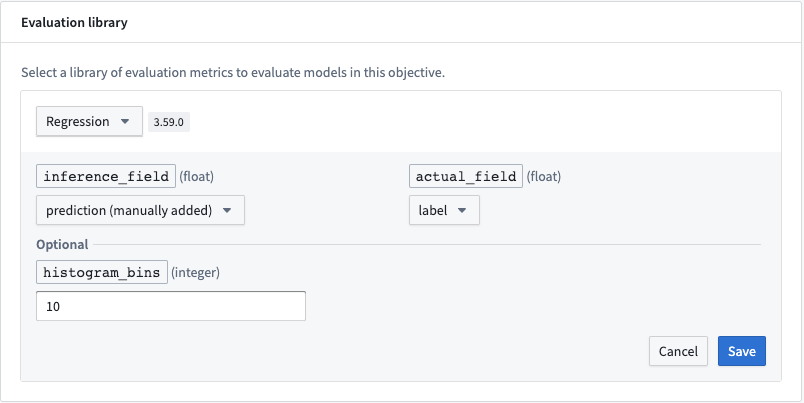
Required fields
The following fields are required for a regression evaluator. The expected value type for these columns is integer.
- inference_field: Column that represents the prediction of the model.
- actual_field: Column containing values to which a model's predictions should be compared.
Optional fields
- histogram_bins: The number of buckets into which to group the residuals and model scores for the plots of score distribution and residuals. If not provided, this will default to
10.
中文翻译
回归评估器(Regression evaluator)
建模目标中的默认评估库之一是回归评估器。该库提供了一组常用于评估回归模型的核心指标。
包含的指标
:::callout{theme="neutral"} 以下指标针对评估仪表板中配置的每个子集桶生成。 :::
默认回归评估器生成以下数值指标:
- 行数(Row Count): 评估数据集中的记录数量。
- 平均绝对误差(Mean Absolute Error): 标签数据与模型预测之间的平均误差(差值),不考虑误差方向。该值始终为正,当模型在评估数据集上表现更好时趋近于0。
- 均方根误差(Root Mean Squared Error): 与平均绝对误差类似,均方根误差也表示标签数据与模型预测之间的差值,忽略误差方向。但均方根误差对偏离标签数据较远的预测赋予更大权重。该值始终为正,当模型在评估数据集上表现更好时趋近于0。
- R2分数(R2 Score): R2(R平方)分数表示模型解释的标签数据方差比例。该值始终小于或等于1,分数越接近1表示模型在评估数据集上表现越好。R2分数可能为负值。
- 解释方差(Explained Variance): 与R2分数类似,表示模型预测解释的标签数据方差比例。当平均误差非零时,解释方差与R2分数存在差异;这种差异表明模型存在偏差。该值始终小于或等于1,分数越接近1表示模型在评估数据集上表现越好。解释方差可能为负值。
默认回归评估器生成以下图表:
- 分数分布(Score distribution): 显示评估数据集上模型预测分布的图表。
- 残差(Residuals): 显示评估数据集上残差分布的图表,其中残差为
label_value - prediction。
配置
有关完整配置说明,请参阅如何配置模型评估库的文档。
必填字段
回归评估器需要以下字段。这些列预期的值类型为整数。
- inference_field: 表示模型预测的列。
- actual_field: 包含用于与模型预测进行比较的值的列。
可选字段
- histogram_bins: 用于将残差和模型分数分组到分数分布和残差图表中的桶数量。如果未提供,默认值为
10。