AIP Logic metrics(AIP Logic 指标)
AIP Logic resources are backed by functions, and when an AIP Logic resource executes, metrics are surfaced for the underlying function execution, including success and failure counts and the P95 execution duration over the last 30 days.
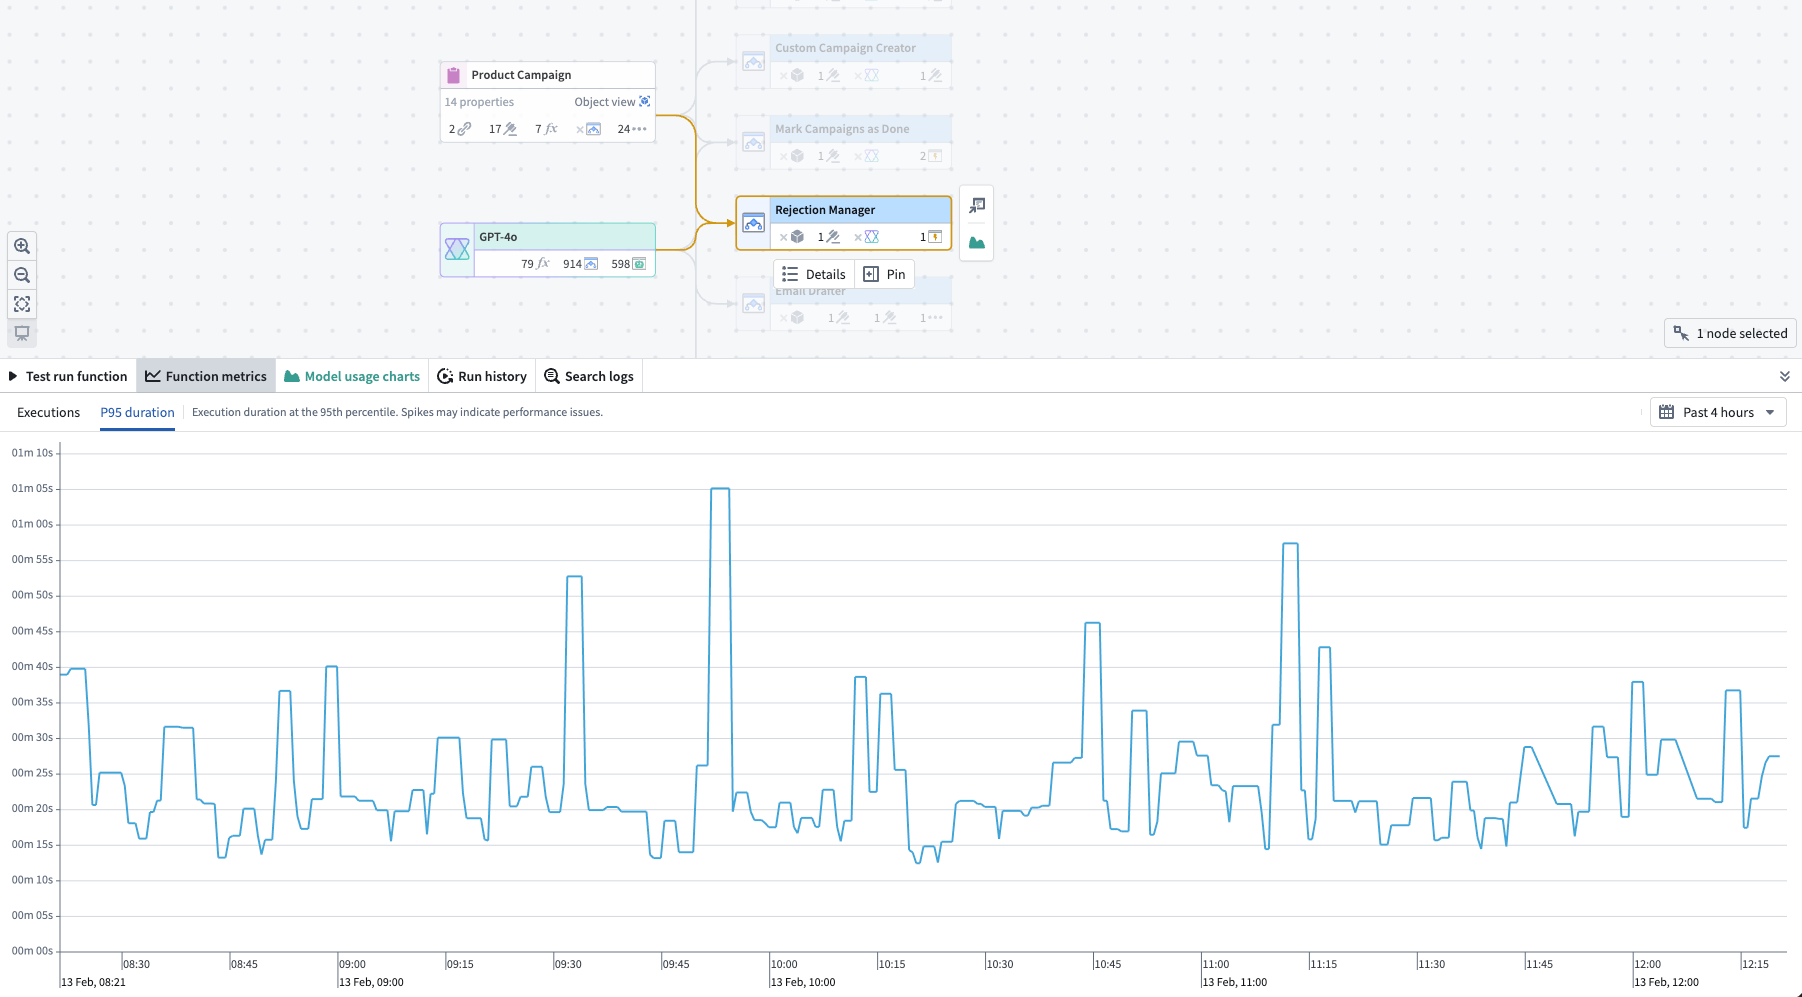
You can view these metrics in Ontology Manager or in Workflow Lineage. In Workflow Lineage, select the AIP Logic node for a given execution. This provides visibility into:
- Success/failure metrics: Monitor the current status of your AIP Logic executions with success and failure counts for the underlying function.

- P95 duration metric: Track the 95th percentile (P95) execution duration, helping you detect performance bottlenecks and optimize workflows.
You can also access run history, which provides a complete view of executions over the past seven days. Learn more about AIP observability.
All metrics are updated in near-real-time using the latest data from the Foundry Telemetry Service (FTS). This ensures you have access to the most current information for monitoring, debugging, and maintaining the health of your AIP Logic resources.
Failure types for AIP Logic executions follow the same categories as function failure types. Refer to the function metrics documentation for a full list of failure categories.
Permissions
To view AIP Logic metrics, you must be a viewer on the AIP Logic resource.
中文翻译
AIP Logic 指标
AIP Logic 资源由函数(Function)提供支持。当 AIP Logic 资源执行时,系统会呈现底层函数执行的指标,包括过去 30 天内的成功与失败次数,以及 P95 执行时长。
您可以在本体论管理器(Ontology Manager)或工作流血缘(Workflow Lineage)中查看这些指标。在工作流血缘中,选择特定执行的 AIP Logic 节点,即可获得以下可见性:
- 成功/失败指标: 通过底层函数的成功与失败次数,监控 AIP Logic 执行的当前状态。
- P95 时长指标: 追踪第 95 百分位(P95)的执行时长,帮助您检测性能瓶颈并优化工作流。
您还可以访问运行历史(Run History),该功能提供过去七天内执行的完整视图。了解更多关于 AIP 可观测性(AIP Observability)的信息。
所有指标均使用来自 Foundry 遥测服务(Foundry Telemetry Service, FTS)的最新数据,以近乎实时的方式更新。这确保您能够获取最新信息,用于监控、调试和维护 AIP Logic 资源的健康状态。
AIP Logic 执行的失败类型与函数失败类型(Function Failure Types)采用相同的分类。有关失败类别的完整列表,请参阅函数指标(Function Metrics)文档。
权限
要查看 AIP Logic 指标,您必须是 AIP Logic 资源的查看者(viewer)。