AIP usage metrics and observability(AIP 使用指标与可观测性(AIP usage metrics and observability))
:::callout{theme="neutral"} The application previously known as Workflow Builder is now called Workflow Lineage. :::
To start using Workflow Lineage, open a Workshop application or functions repository and use the keyboard shortcut Command + I (macOS) or Ctrl + I (Windows) to view the relevant Workflow Lineage graph depicting the objects, actions, and functions that back the application.
AIP usage metrics
The following sections will help you understand the various AIP usage metrics viewable in Workflow Lineage.
Model usage coloring
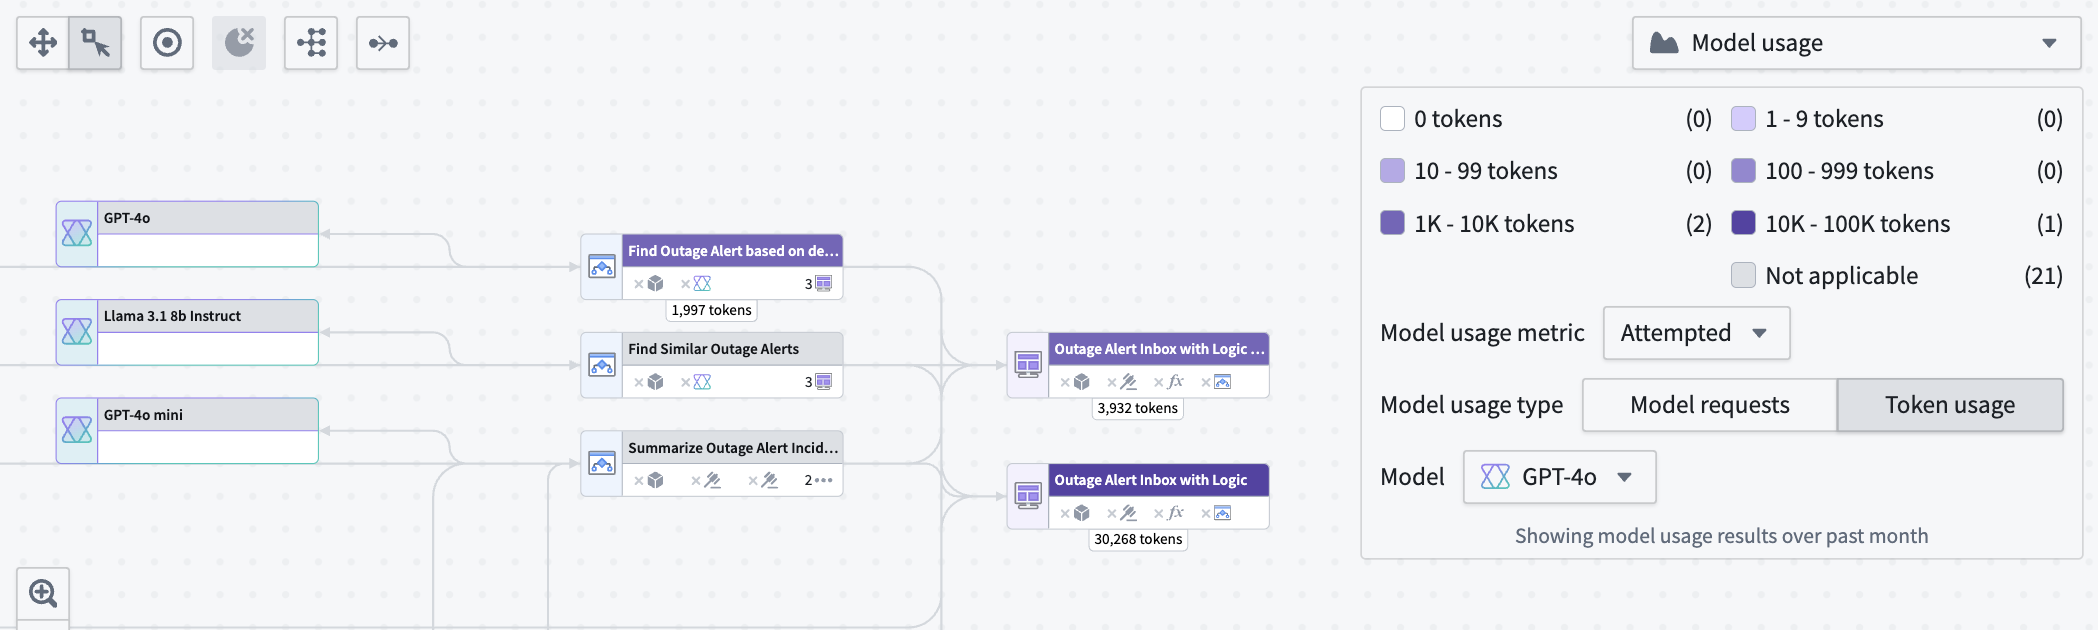
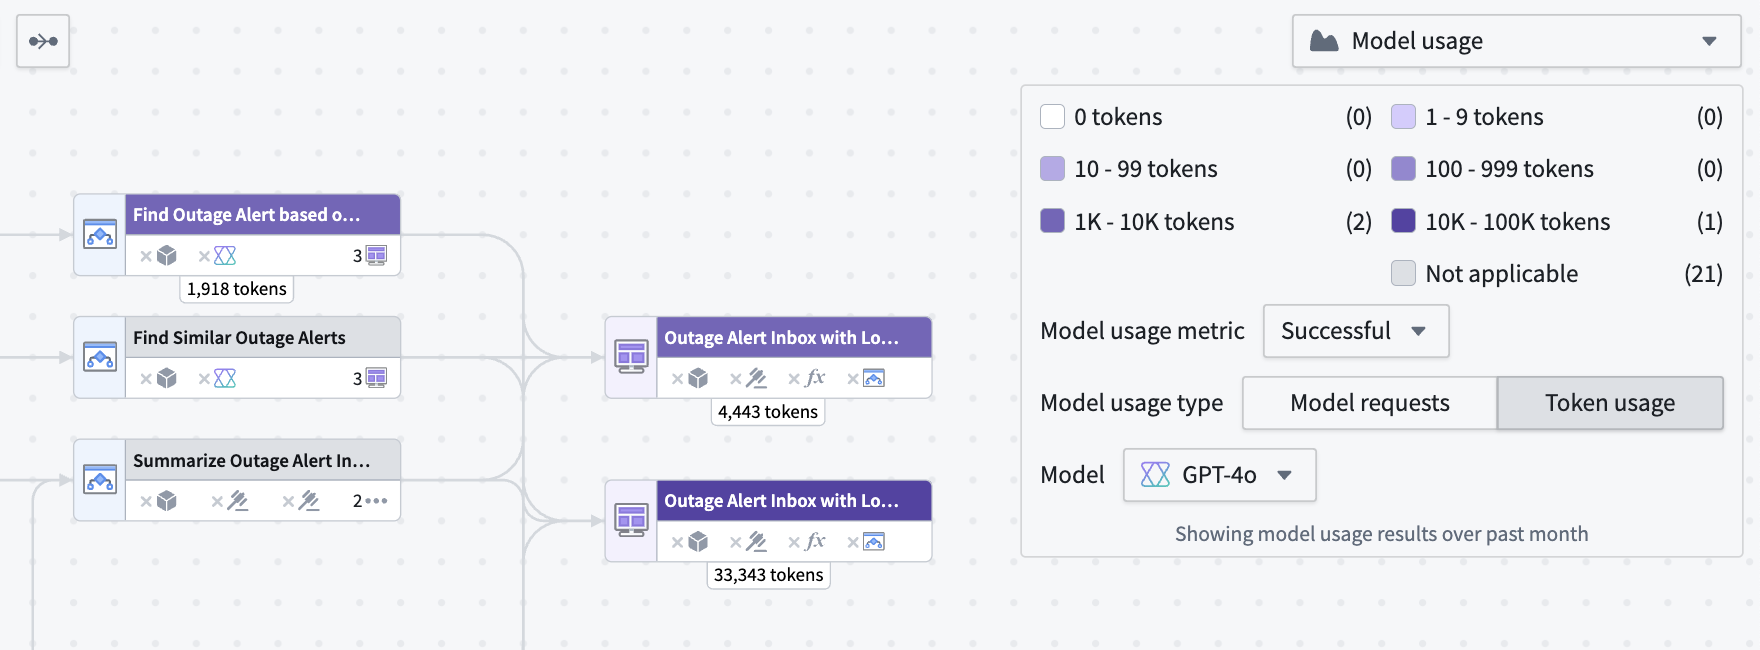
Workflow Lineage allows you to view model metrics for model requests and token usage. There are three types of model usage metrics:
- Successful: Total successful model requests or tokens used in attempts made by the specified model.
- Attempted: Total attempts made by the model, including successful and rate-limited attempts.
- Rate-limited: Total rate-limited attempts made.
Under Model usage, specify whether you want to view Model requests or Token usage metrics.
Model requests shows the total number of specified requests on model nodes in your Workflow Lineage.

Token usage shows the number of tokens used for Workshop applications, Automations, or third-party OSDK applications. Token counts on Logic nodes are the token counts used in the Logic application debugger.
Model usage charts
You can view the token usage or model requests over time for Workshop applications, Automations, and third-party applications (Ontology SDK applications) over time in a line chart by selecting the nodes and opening the Model usage charts panel at the bottom.
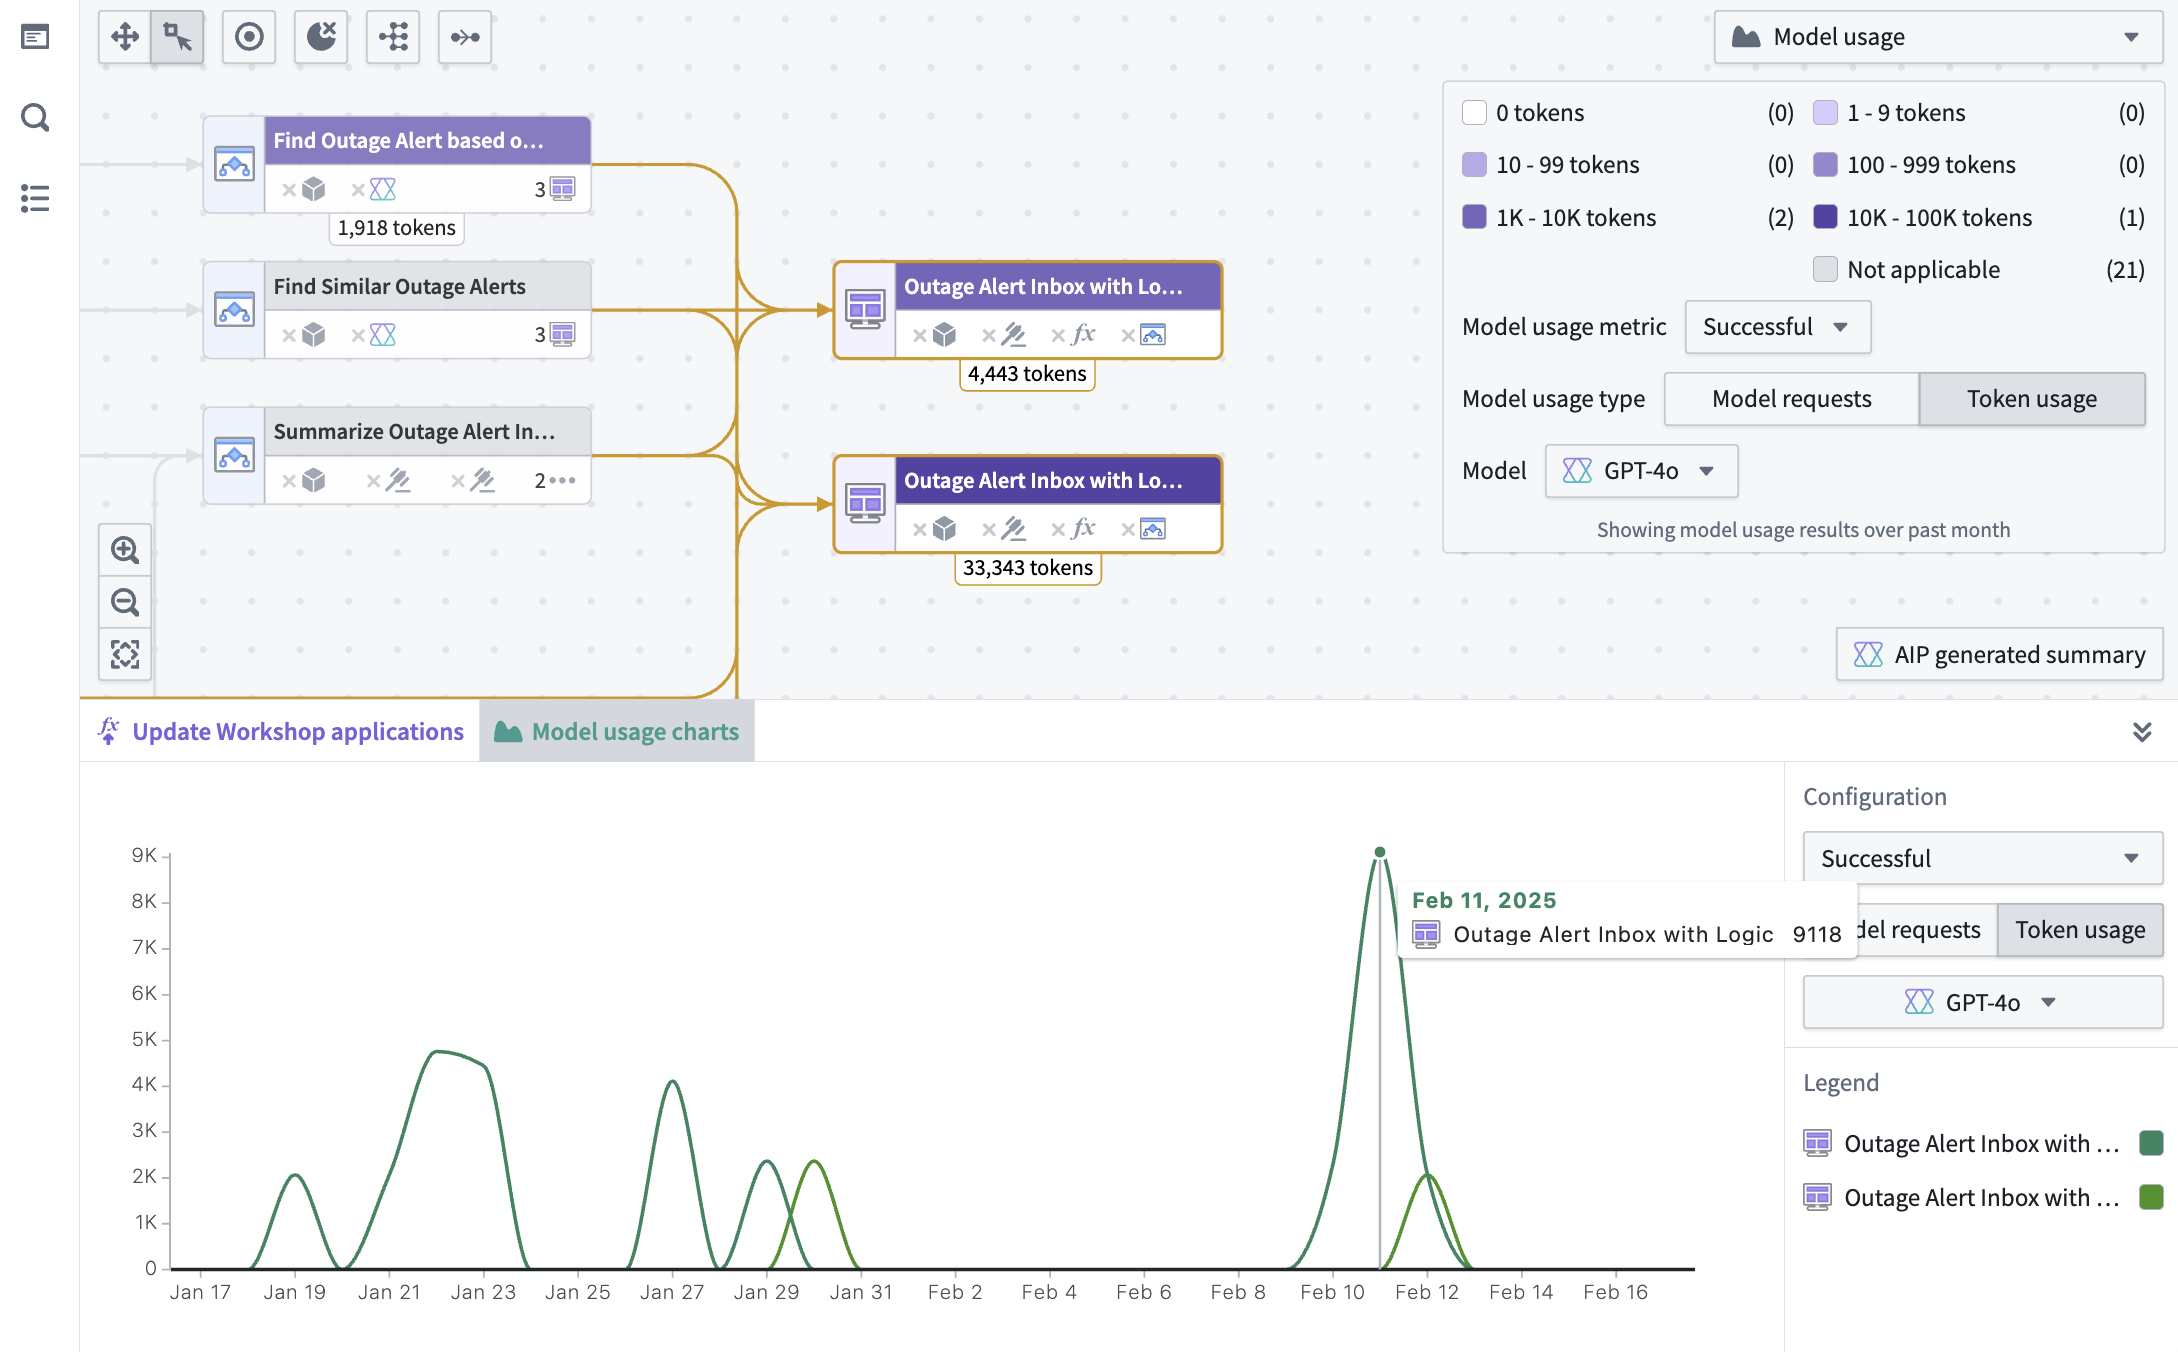
To view the specific value for a particular resource, hover over the graph itself. The same filters that are used in the color legend explained above also appear in the charts panel.
Bulk replace models
Once you identify model usage you want to migrate or replace, open the Replace model tab in the bottom panel to replace a language model across multiple AIP Logic functions in a single action. For step-by-step instructions, see the bulk replace models documentation.
AIP observability
Workflow Lineage provides observability features to help you monitor and debug your AIP workflows. You can track execution history, visualize distributed traces, access detailed logs, and analyze performance metrics for your functions, actions, language models, and automations.
For detailed information about AIP observability features, view the AIP observability documentation.
中文翻译
AIP 使用指标与可观测性(AIP usage metrics and observability)
:::callout{theme="neutral"} 原名为"工作流构建器"(Workflow Builder)的应用现已更名为"工作流血缘"(Workflow Lineage)。 :::
要开始使用工作流血缘,请打开 Workshop 应用或函数仓库,并使用键盘快捷键 Command + I(macOS)或 Ctrl + I(Windows)查看相关的工作流血缘图,该图展示了支撑应用的对象、操作和函数。
AIP 使用指标(AIP usage metrics)
以下章节将帮助您理解工作流血缘中可查看的各种 AIP 使用指标。
模型使用着色(Model usage coloring)
工作流血缘允许您查看模型请求和令牌使用量的模型指标。共有三种类型的模型使用指标:
- 成功(Successful): 指定模型尝试中成功的模型请求总数或使用的令牌总数。
- 尝试(Attempted): 模型尝试的总次数,包括成功和被限流的尝试。
- 被限流(Rate-limited): 被限流的尝试总数。
在模型使用下,指定您要查看模型请求(Model requests)还是令牌使用量(Token usage)指标。
模型请求显示工作流血缘中模型节点上指定请求的总数。
令牌使用量显示 Workshop 应用、自动化(Automations)或第三方 OSDK 应用所使用的令牌数量。逻辑节点上的令牌计数是逻辑应用调试器中使用的令牌数量。
模型使用图表(Model usage charts)
您可以通过选择节点并打开底部的模型使用图表面板,以折线图形式查看 Workshop 应用、自动化和第三方应用(Ontology SDK 应用)随时间变化的令牌使用量或模型请求。
要查看特定资源的具体数值,请将鼠标悬停在图表上。上述颜色图例中使用的相同筛选条件也会出现在图表面板中。
批量替换模型(Bulk replace models)
一旦您识别出需要迁移或替换的模型使用情况,请打开底部面板中的替换模型(Replace model)选项卡,通过单个操作批量替换多个 AIP 逻辑函数中的语言模型。有关分步说明,请参阅批量替换模型文档。
AIP 可观测性(AIP observability)
工作流血缘提供了可观测性功能,帮助您监控和调试 AIP 工作流。您可以跟踪执行历史、可视化分布式追踪、访问详细日志,并分析函数、操作、语言模型和自动化的性能指标。
有关 AIP 可观测性功能的详细信息,请查看 AIP 可观测性文档。