Getting started(入门指南)
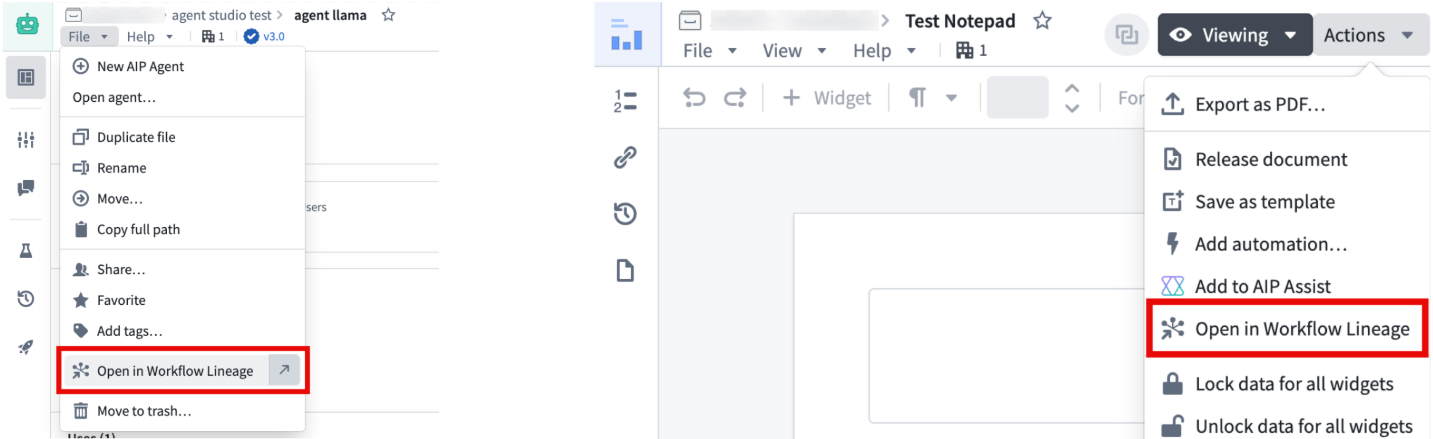
To get started with Workflow Lineage, use the keyboard shortcut Cmd + i (macOS) or Ctrl + i (Windows) to view the Workflow Lineage graph depicting the objects, actions, and functions that back your resource. You can also navigate to Workflow Lineage from the following applications with the Open in Workflow Lineage navigation option commonly found under File or Actions.
The following applications support these features:
- Workshop
- Objects in Ontology Manager
- Function repositories
- Quiver dashboards
- Machinery
- Slate
- Chatbot Studio
- Automate
- Third-party applications
- Developer Console (Keyboard shortcut only)
- Marketplace (Keyboard shortcut only, in a draft resource's overview tab.)
- Notepad (Navigation option only)
- Object types in Pipeline Builder (Navigation option only)
Interface
Workflow Lineage's interface consists of the two main components, as seen in the following notional screenshot:
- Graph panel: An interactive graphical view of the entities backing your workflow and the relationships between them.
- Workshop panel: An interactive view of the selected Workshop applications.

Graph panel
When you select nodes on the graph panel, you can see the corresponding Workshop components highlighted on the Workshop panel. This makes it easy to see the exact places that are using specific nodes and can help show you where specific objects are being used.

When you select a specific node on the graph, you can use the Pin option to pin it to the left sidebar or view more details about the node.

To see all linked dependencies for a particular node, select the icon corresponding to the input type you want to see on the graph.
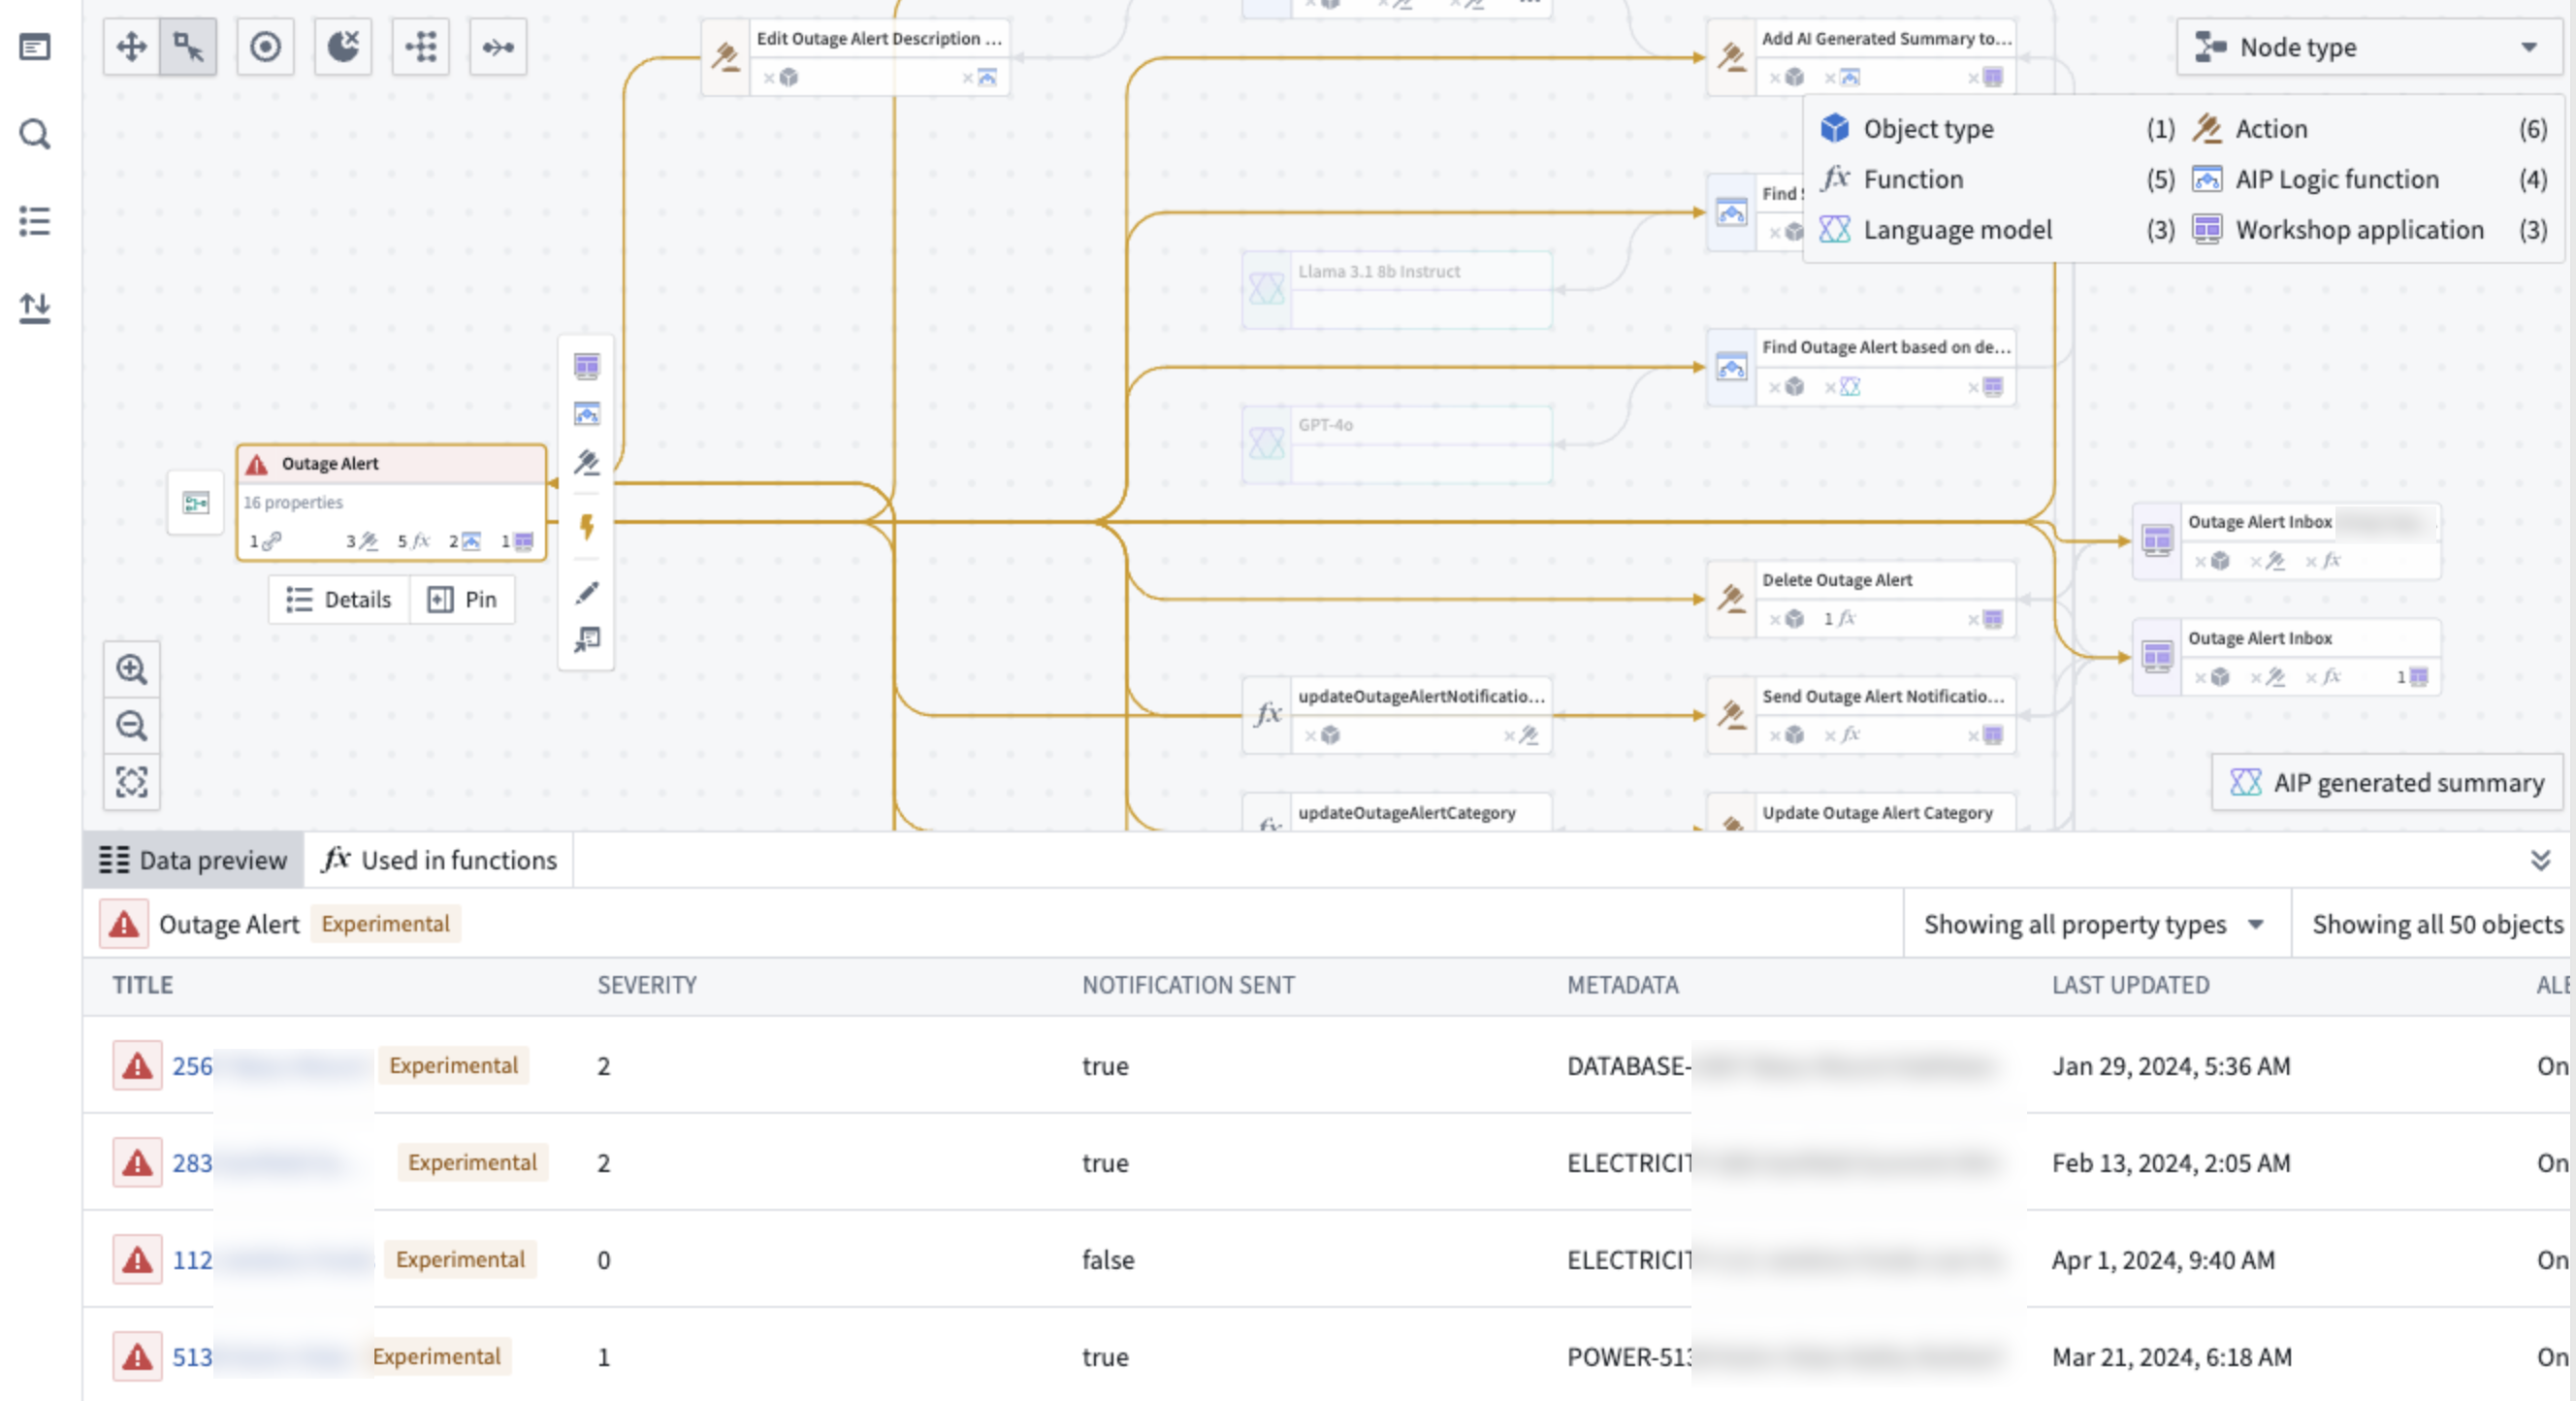
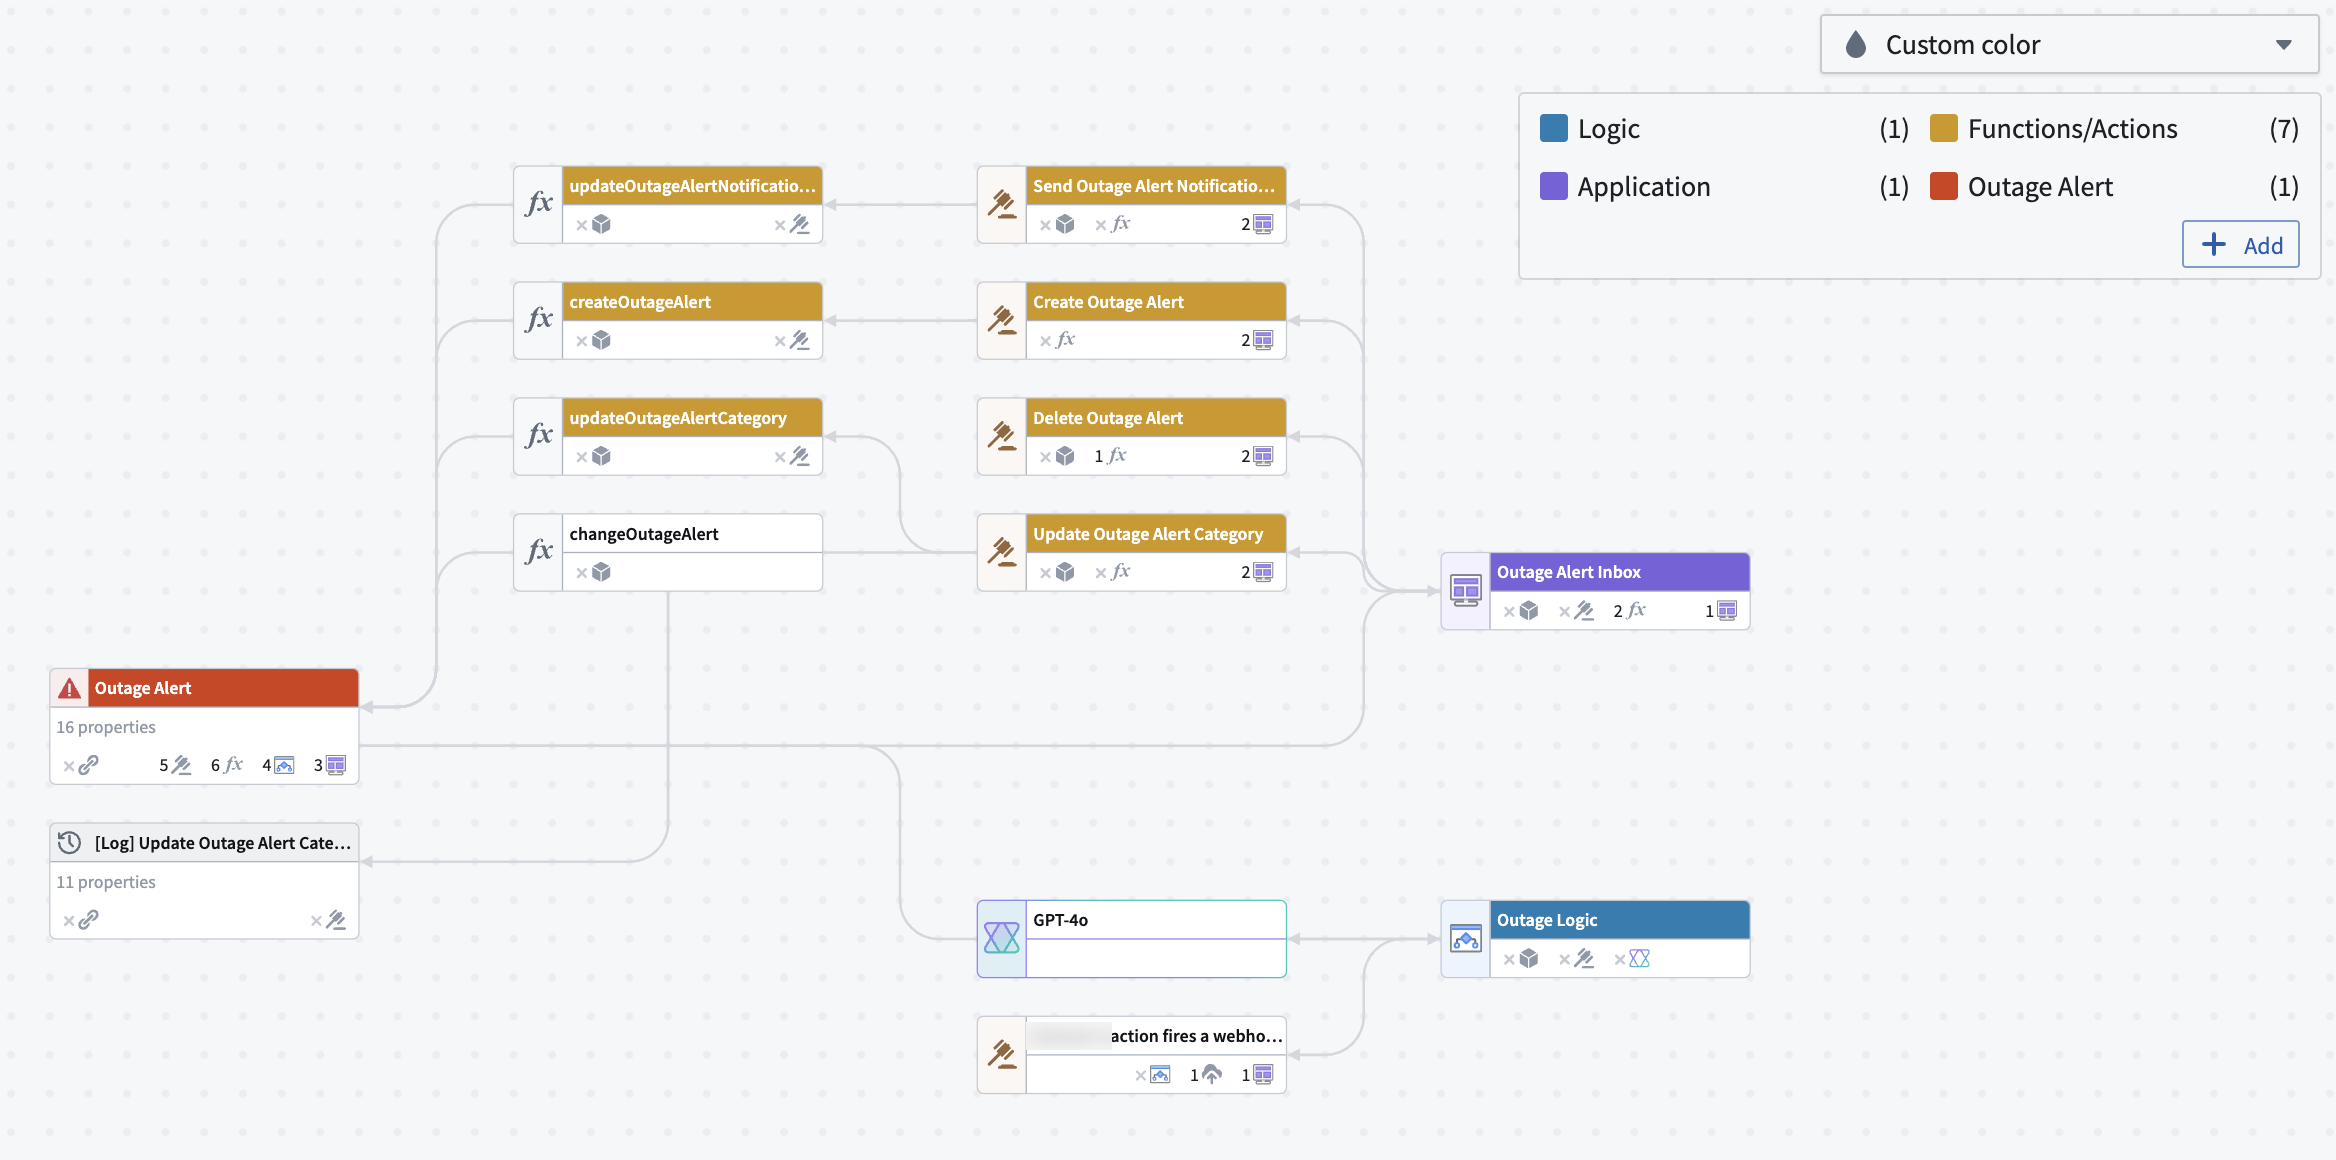
You can view the icons of each node type in the legend at the top right of the graph panel. Object type nodes are represented using the icon specified in the Ontology.
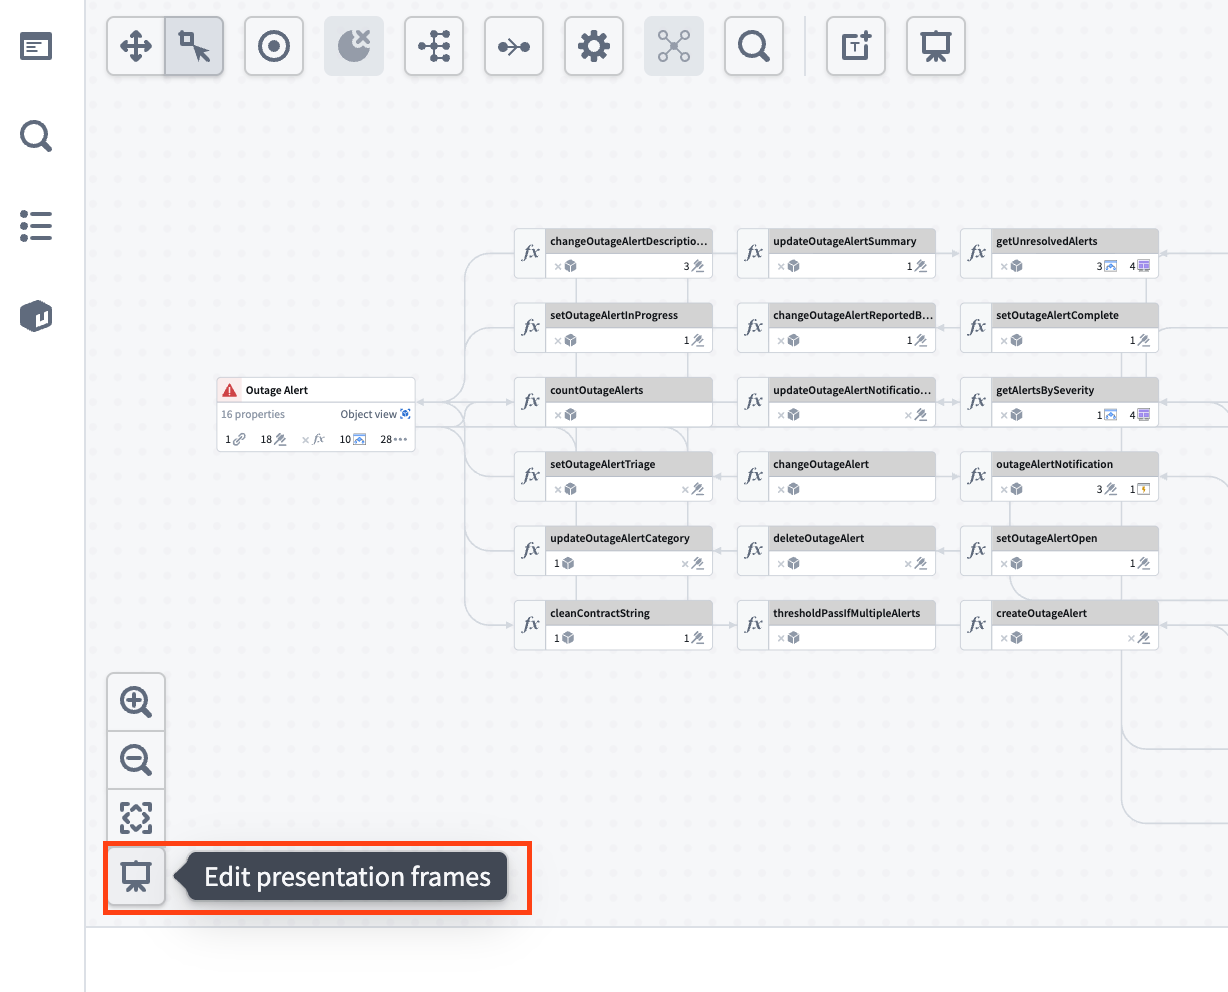
In the example below, we want to see the nine actions dependent on the Outage Alert object. Select the same icon location inline on the object to show and hide those dependencies from view.

Review details of a specific node by selecting the node and then opening the selection details panel on the left side of the screen. Details displayed vary depending on the type of node selected. The following is a list of sample details that can be found for each resource:
- Objects: A list of properties and where those properties are used throughout the workflow (see property provenance linked below), linkages, backing data source, and so on.
- Object links: Resource usage by objects, functions, actions, Workshop applications, and more.
- Functions: Inputs, outputs, dependencies, repository, and other relevant metadata.
- Actions: API, RID, input data, Ontology edits, and submission criteria.
- AIP Logic functions: Dependencies, automations, and metadata about creation details.
- Language models: Model descriptions and metadata on model creator and context windows.
- Workshop applications: Metadata about creation and action, function, and object dependencies.

Support for multiple ontologies
The Workflow Lineage graph displays resources from all relevant ontologies, allowing you to visualize cross-ontology relationships.
If an object, interface or action node belongs to a different ontology, that node will be gray and a warning icon will appear in the upper right corner of the node.
:::callout{theme="neutral"} Action type nodes and object nodes will have limited functionality when you select an ontology different from their own. For example, you can only perform bulk updates on function-backed actions within the currently selected ontology. :::

If multiple ontologies are present, a warning icon will also appear next to the blue cube in the upper right corner of the graph. Though you can only select one ontology at a time, you can view the ontologies present in your graph and switch between them by selecting the cube icon.

Additional details
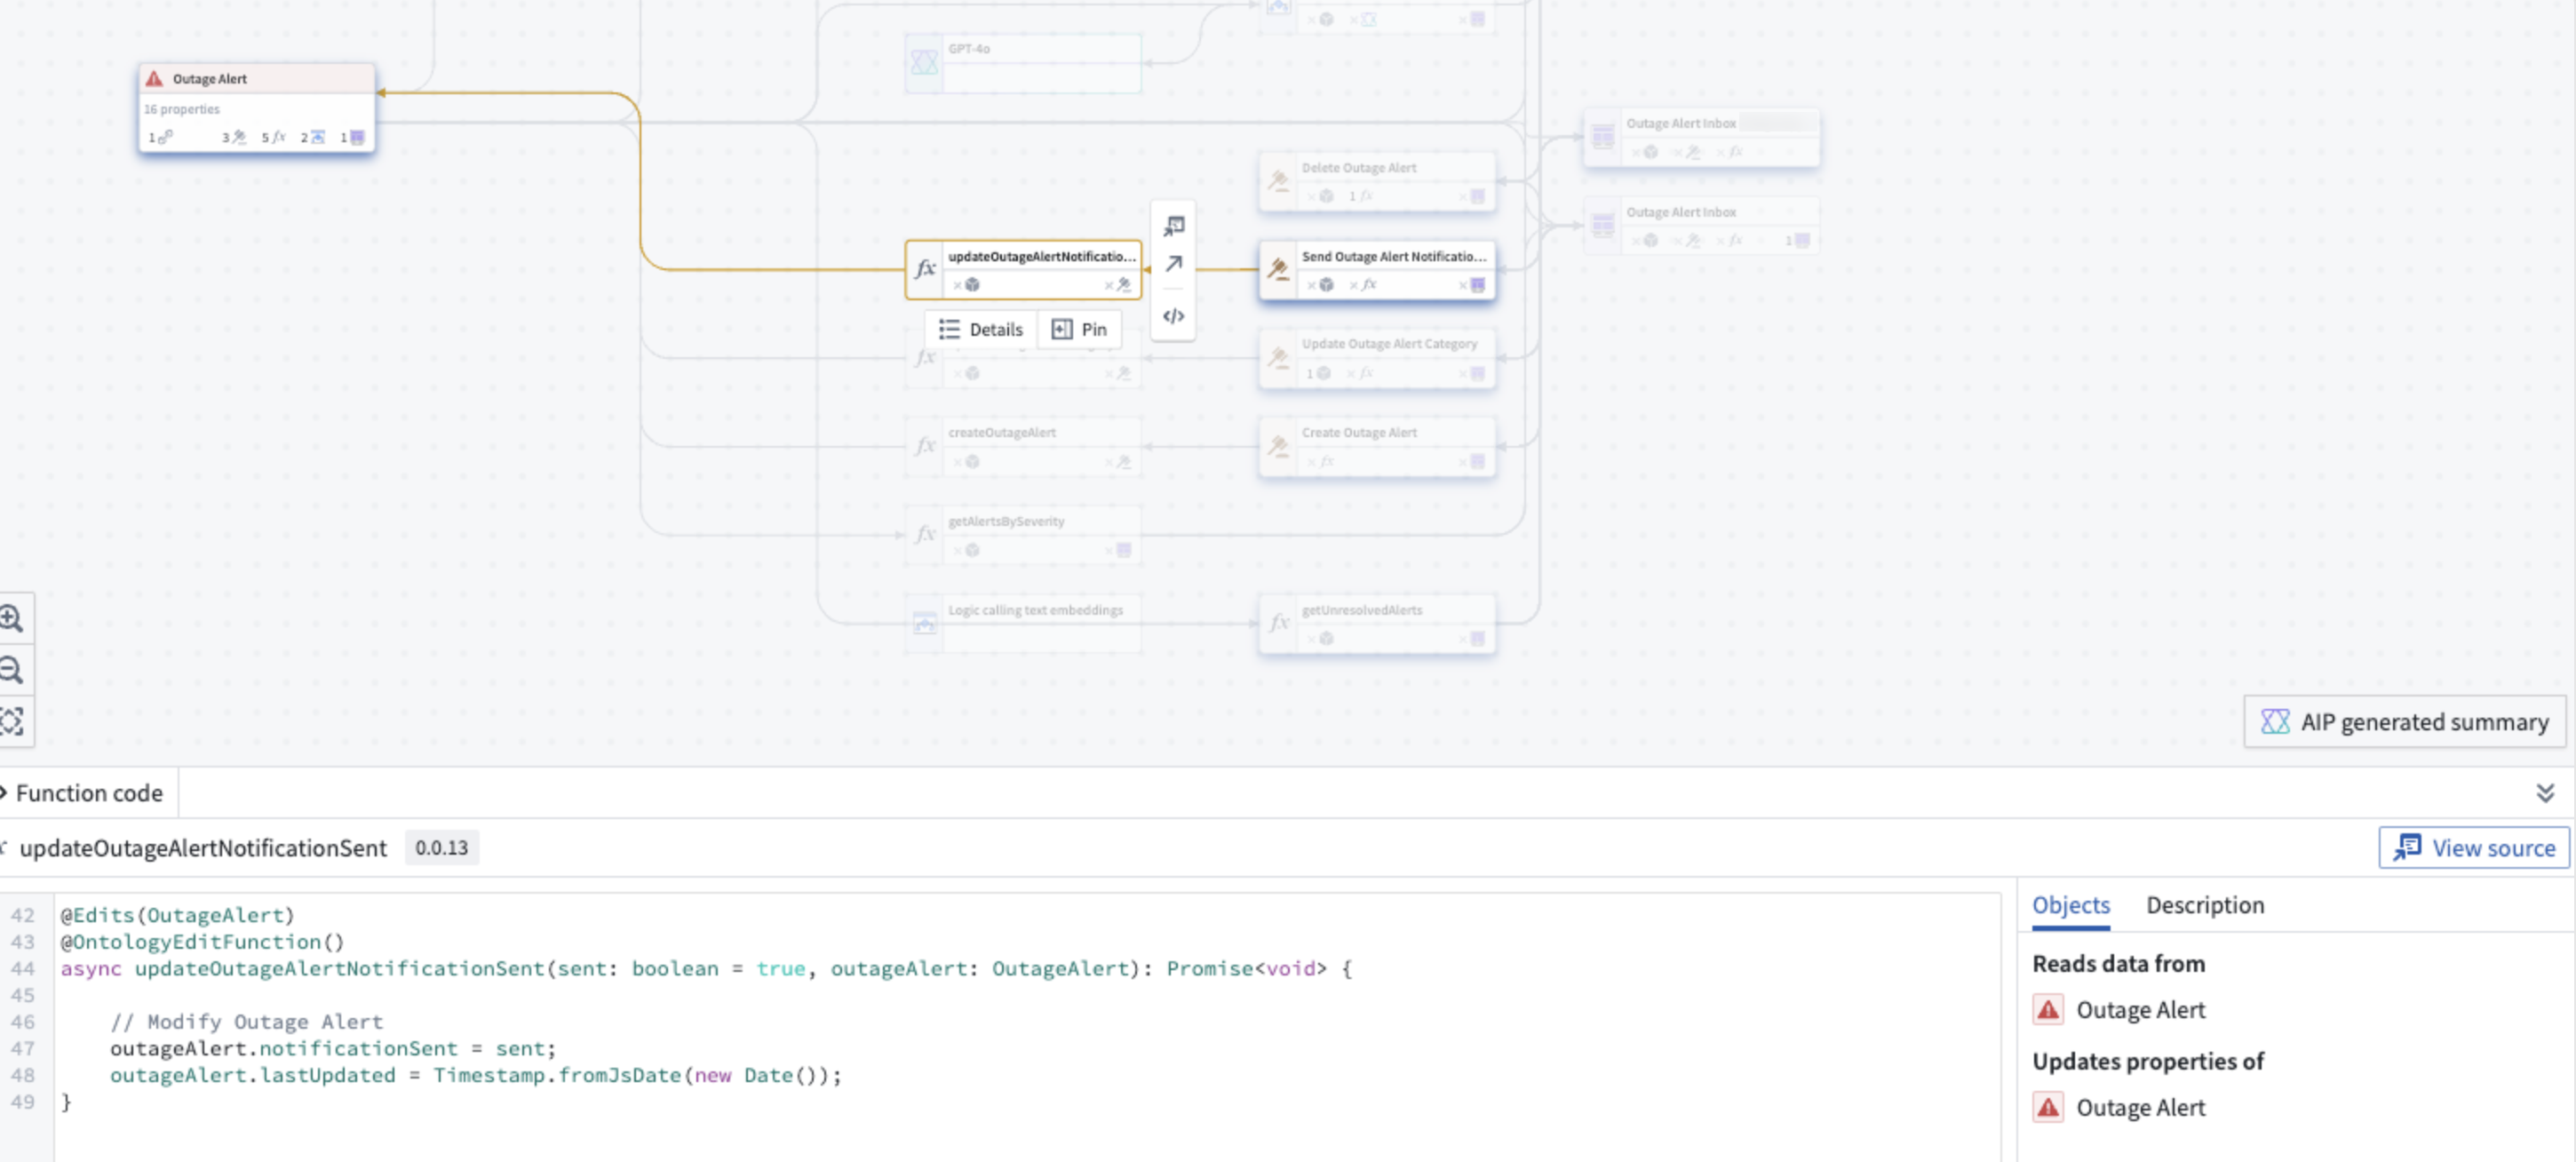
For Functions, you can view the code when you select the node. This includes the objects from which your function reads and a description of the logic. You can also bulk upgrade functions used in Workshop applications.
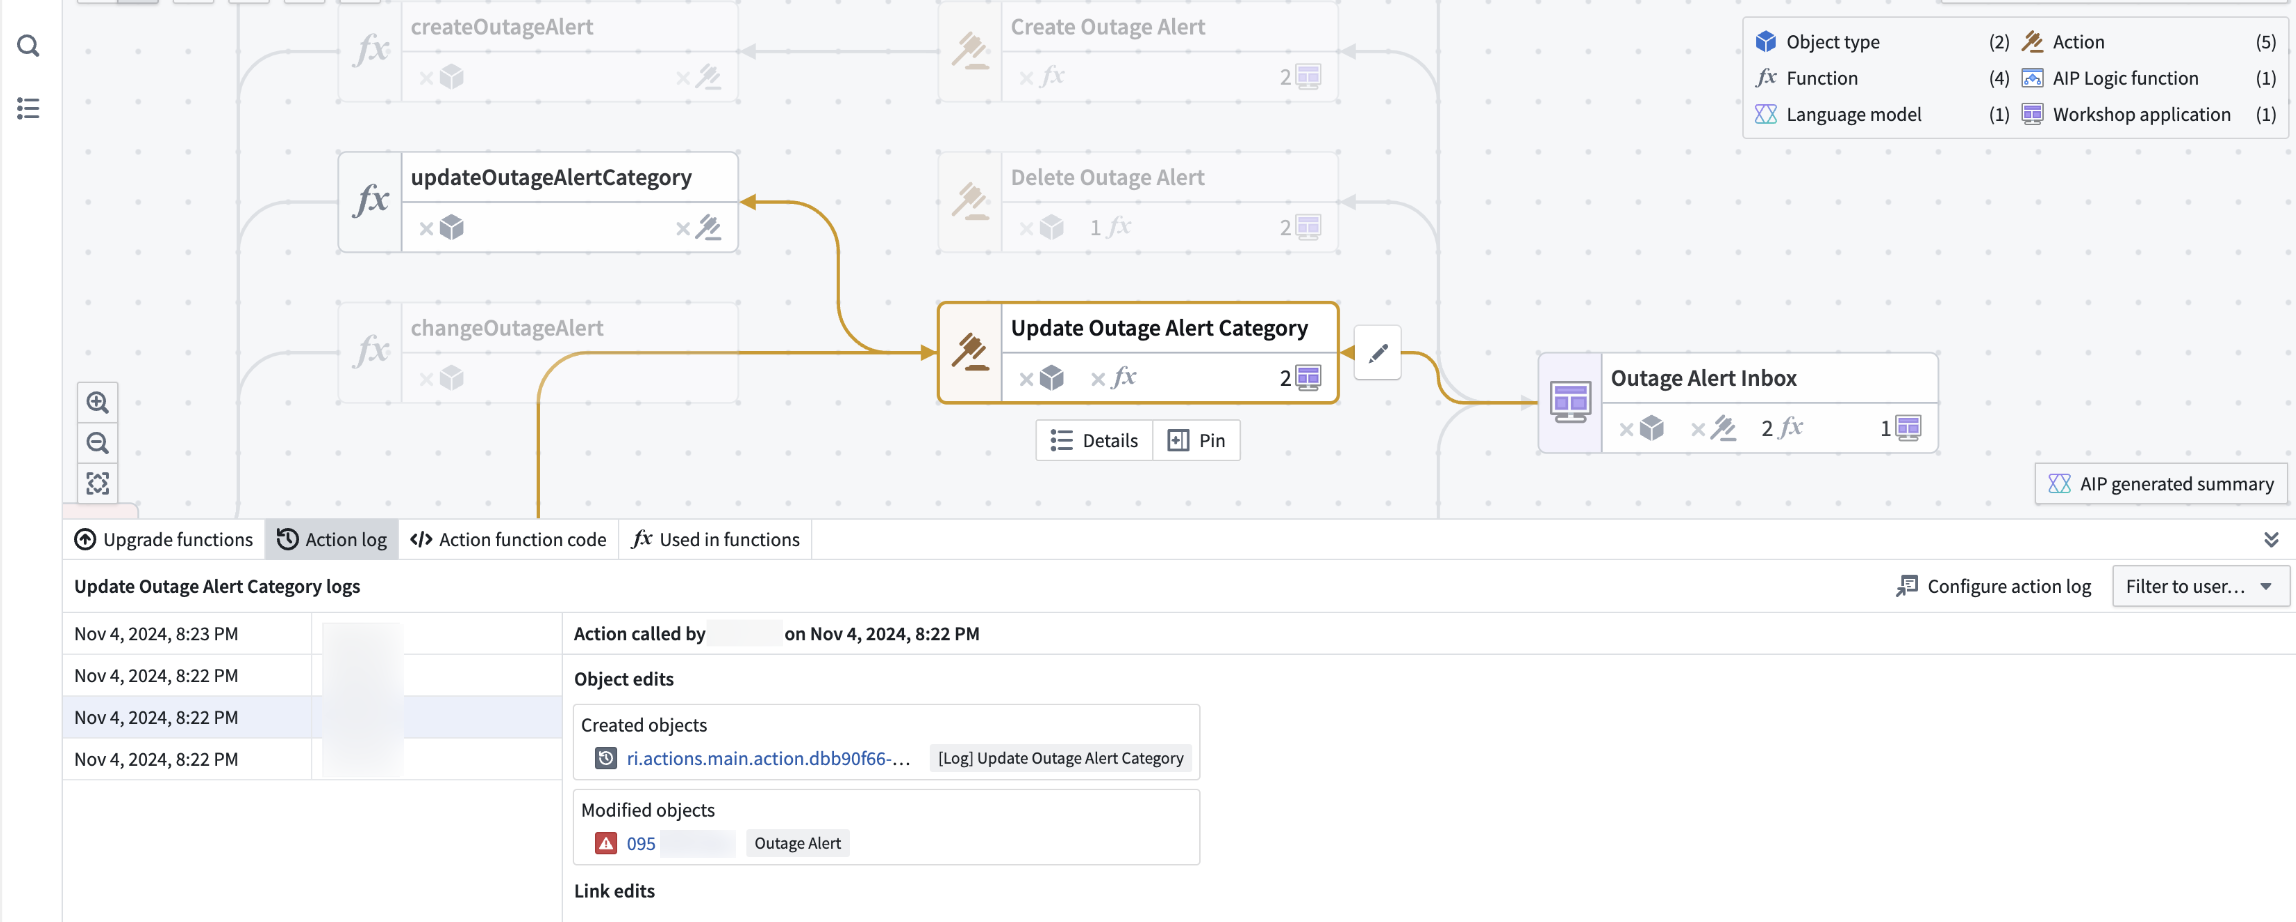
For Actions, you can view the action function code, the action log, and the option to upgrade the action. You can also bulk update the submission criteria on actions and bulk delete actions and objects.
For objects, you can view a preview of the object data. You can also bulk delete actions and objects.
:::callout{theme="warning"}
By default, the lines denoting object links and objects that are inputs to actions are not shown on the graph. To see these relationships, select the object nodes. You can use Cmd + A on macOS and Ctrl + A on Windows as a shortcut to select all nodes.
:::
You can also view object links under the Links section of the Selection details panel. Hover over each object link to show a preview of all usages.
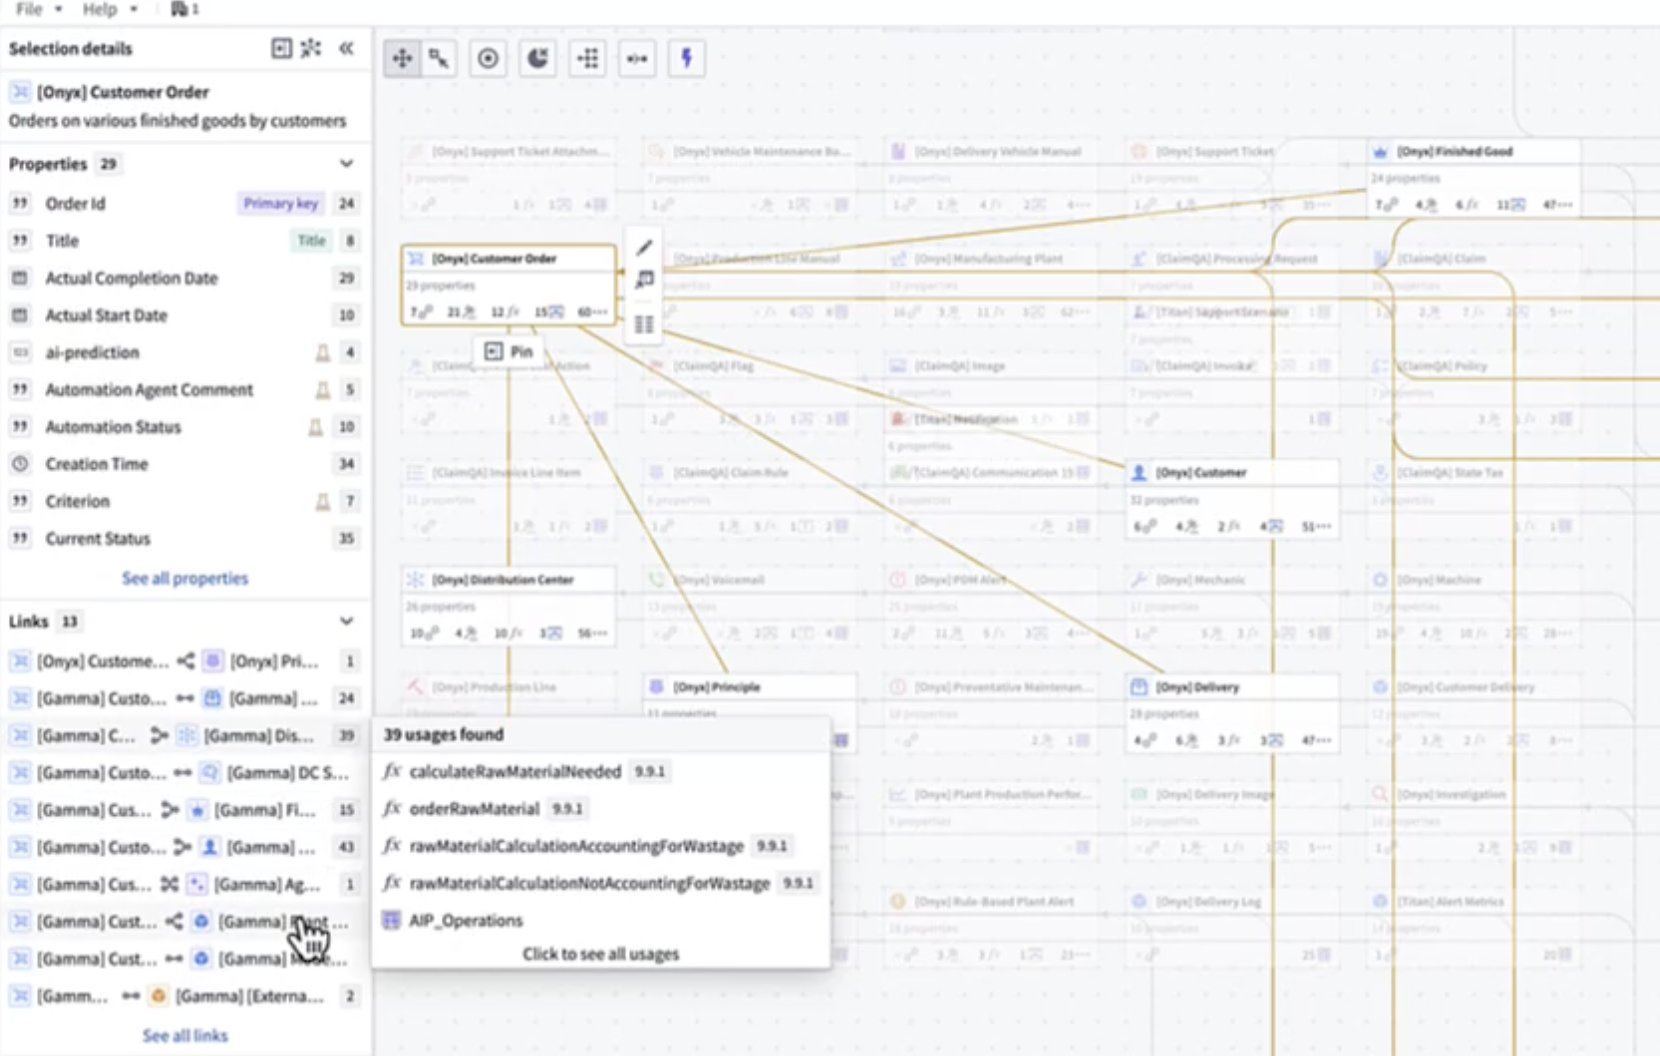
Select the link to view full details. If the link is being edited, a pen icon will appear next to the corresponding usage.

These links will also show up as dependencies in downstream resources.

For Automations, you can view property usages and dependencies in the Selection details sidebar. Under Condition ontology dependencies, you can see a breakdown of the specific object properties on which the automate's condition depends. Hover over the number to view the exact property.

You can also toggle the purple lightning bolt button at the top left of the graph to view the actions and functions that trigger the automation.
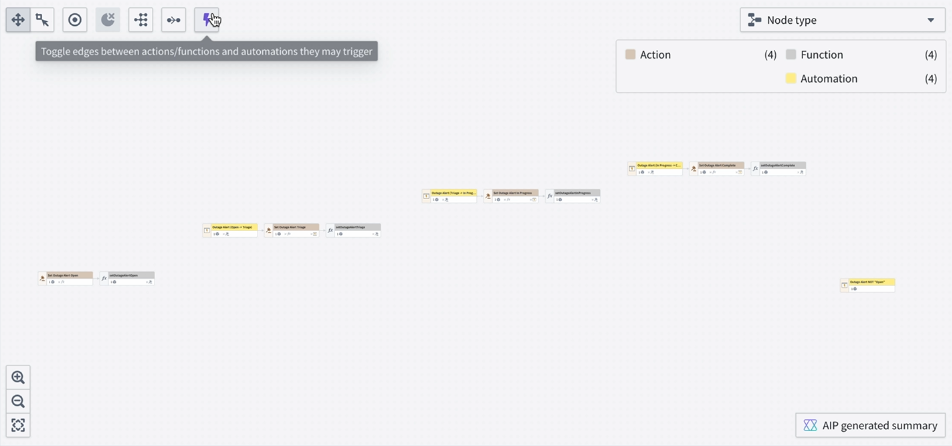
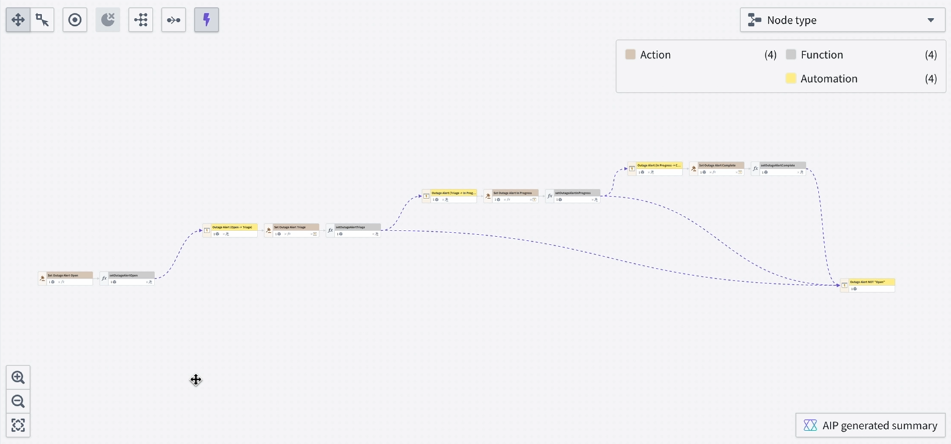
If you have an automation that triggers when a property is a specific value, Workflow Lineage will find the actions or functions that edit that property to that value and link them to the automation.

Workshop panel
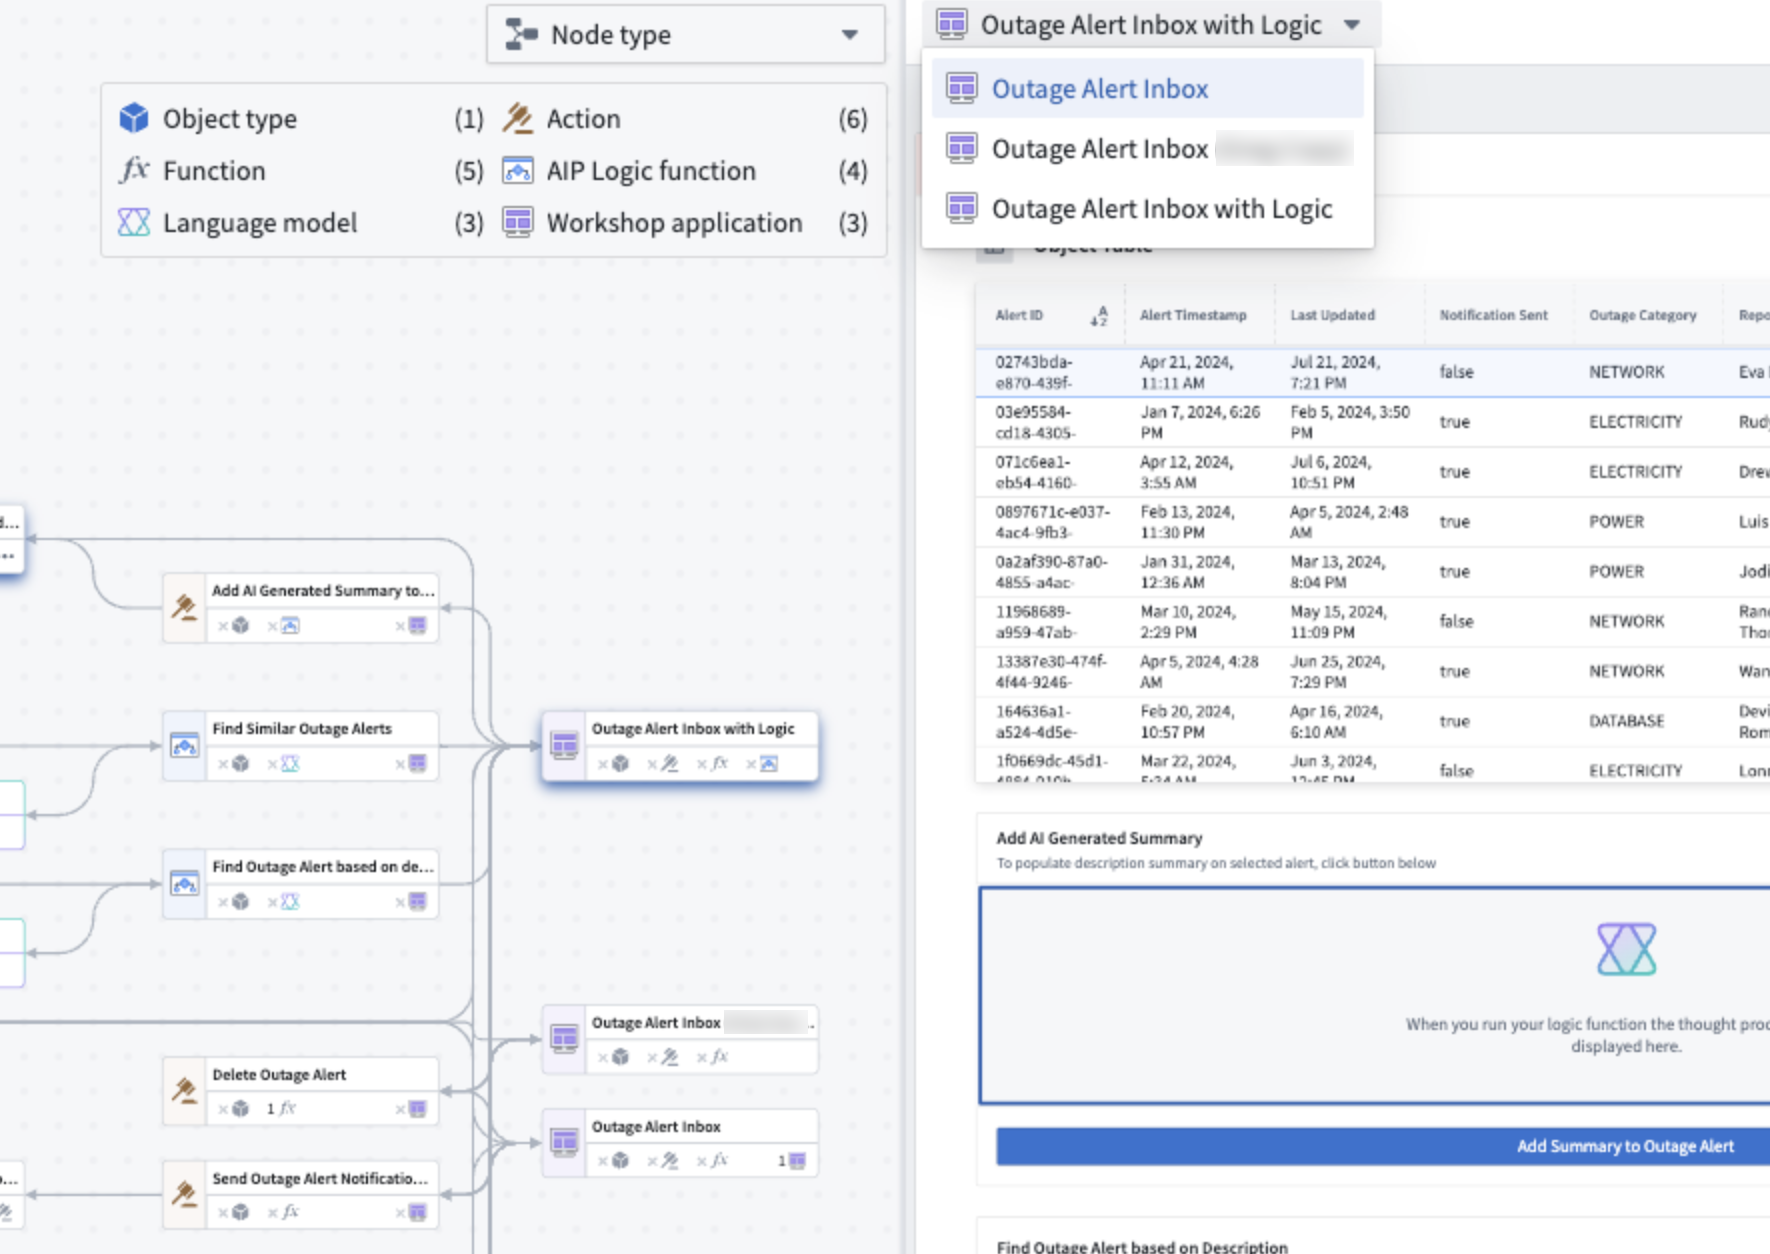
On the Workshop panel, you can select different components and view the corresponding nodes highlighted on the Workflow Lineage graph.
At the bottom of the Workshop panel, the Entities section shows all backing objects and actions used in the application. When you select a specific entity, you can view exactly where the entity is used throughout the Workshop application.
If you have multiple Workshop applications on your graph, you can use the dropdown menu at the top to toggle between Workshop application views.
To reopen the Workshop panel, select any Workshop application on the graph and press I, or double-click on the node.
Color legend options
Workflow Lineage provides a color legend system to help manage security and view metadata about specific applications. Examples of color legends are below:
General
- Node type: Shows the type of resource that each node represents on your graph.
- Custom color: Adds colors into the legend by right-clicking nodes to create a new color group, selecting an existing one, or dragging colors from the legend onto nodes.
Permissions
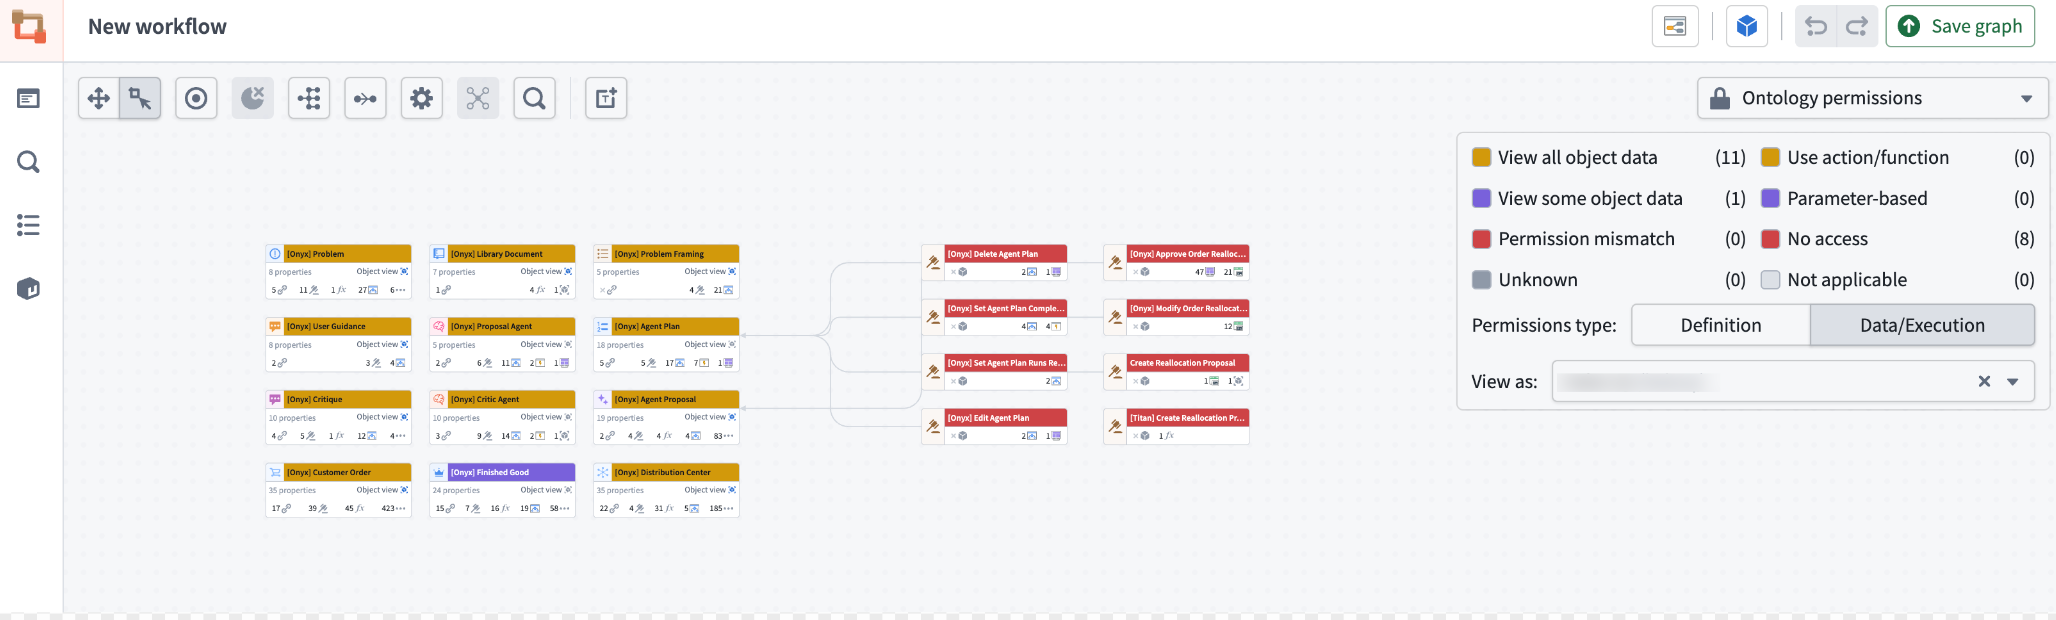
- Ontology permissions: Review the managing security documentation.
- Resource permissions: Review the managing security documentation.
Usage
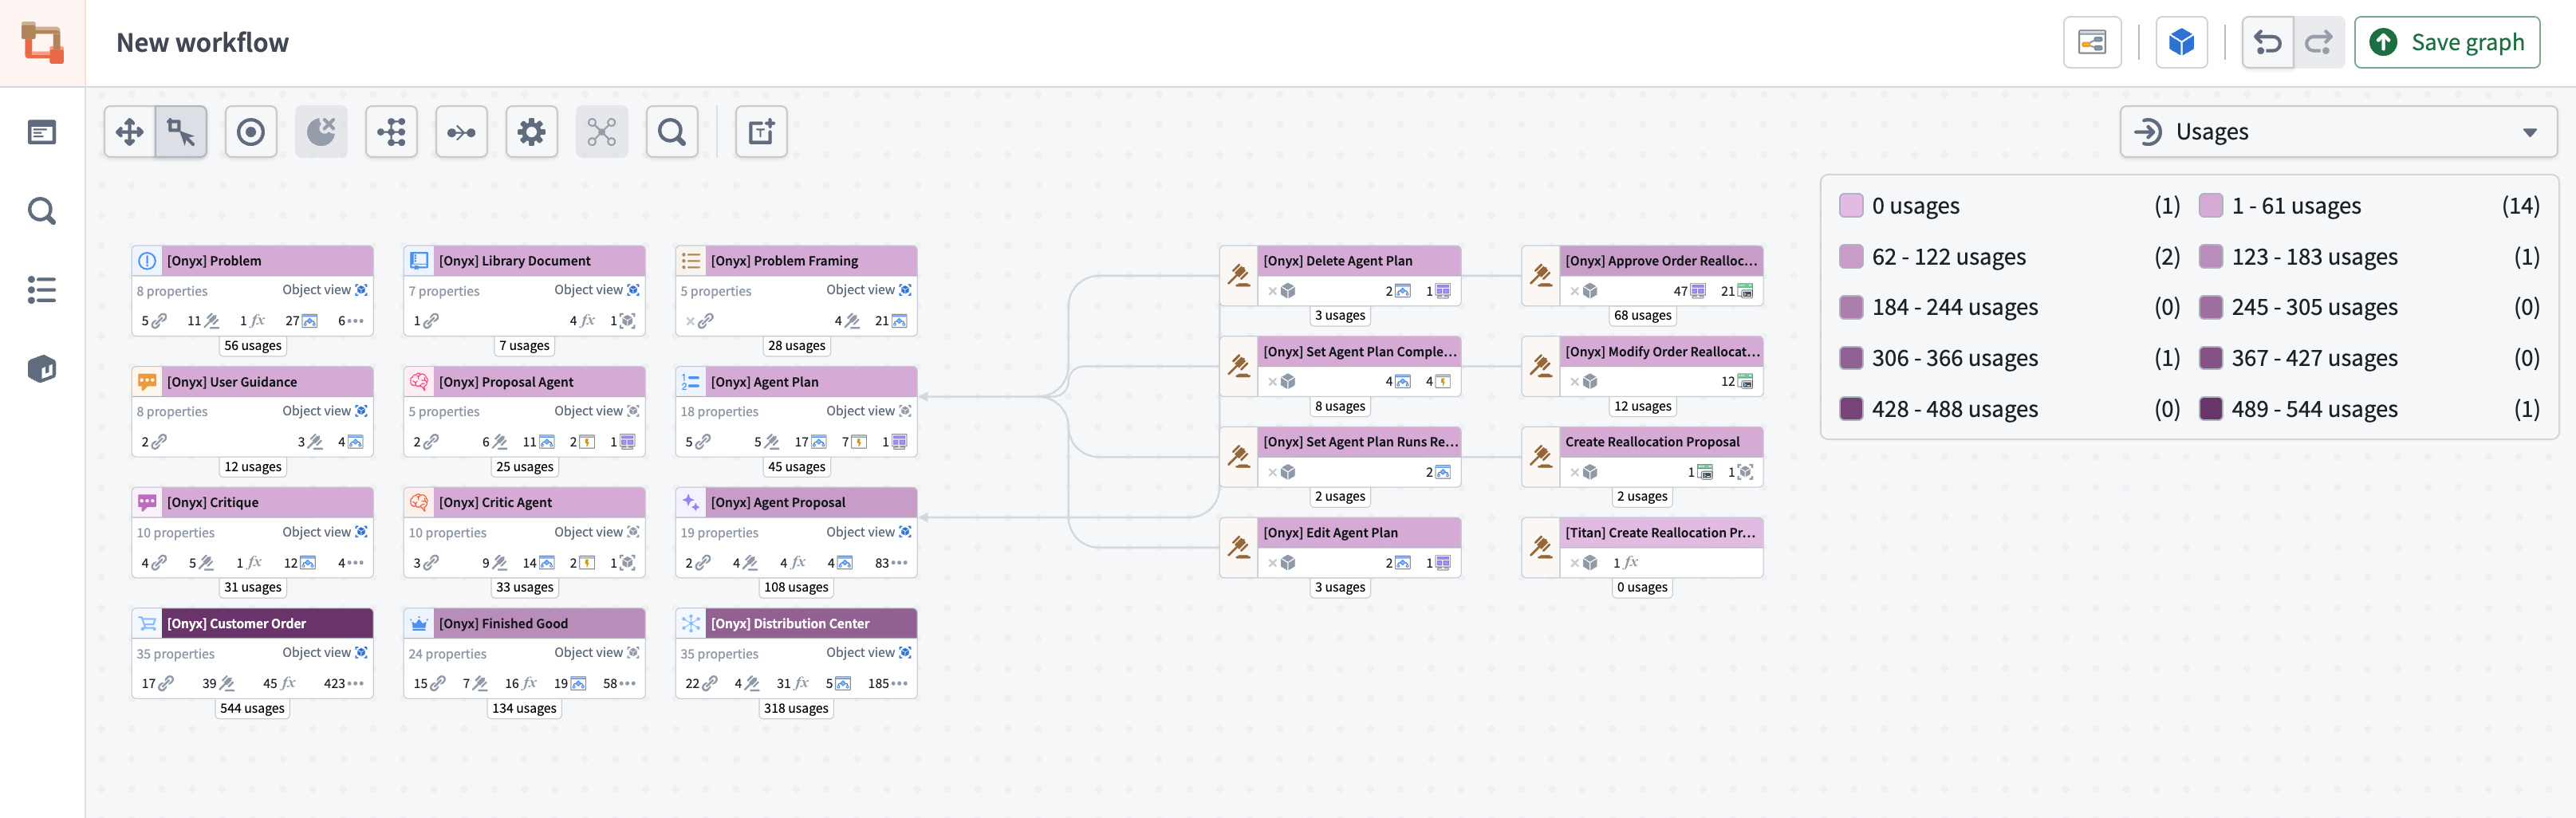
- Usages: Applies color to Workshop applications based on how many views that application had over the past four weeks, in both view and edit mode.
- Out of date functions: Review the action-backed function upgrades section.
- Application views: Applies color to Workshop applications based on how many views that application had over the past four weeks, in both view and edit mode.
- Model usage: Review the AIP usage metrics section.
- Ontology status: Applies color to nodes based on
Active,Experimental,Deprecated,Example, andPromotedstatuses. - Action rule: Applies color to nodes based on whether it runs a function, creates, modifies, or deletes objects, or does a combination of any of the above.
- Automation expiration: Applies color to automation nodes based on their expiration date.
- Last modified: Applies color to nodes based on their last modified date.
Organization
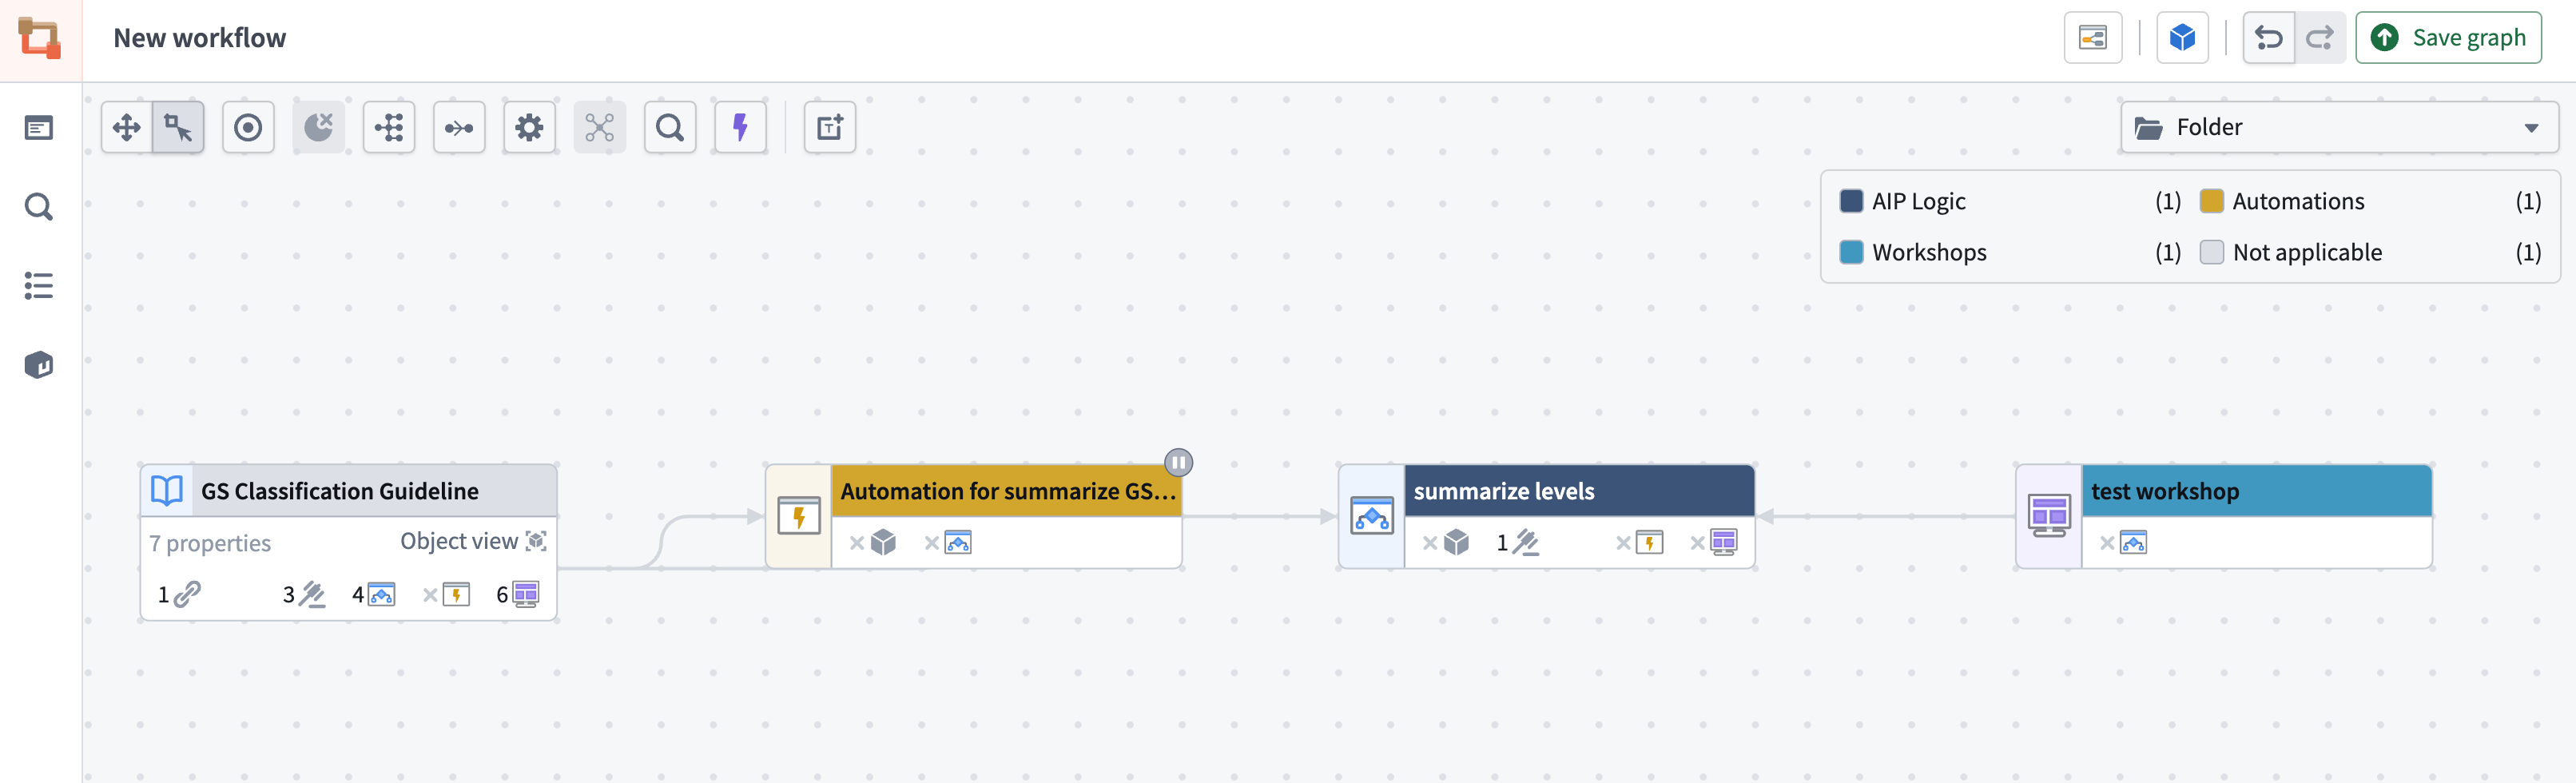
- Folder: Applies color to nodes based on the folder each node lives in.
- Project: Applies color to nodes based on the project each node lives in.
- Portfolio: Applies color to nodes based on the portfolio each node lives in.
- Functions repository: Applies color to function nodes based on the functions repository each node lives in.
Text nodes
You can add text nodes in Workflow Lineage to help document and call attention to details in your graph. Text nodes use Markdown syntax ↗, and they can be colored like regular nodes. They will not be affected by layout options and are not attached to any specific node on your graph.

- To add a text node to your graph, select Text in the top-left of the graph.
- Double click the text node to edit and add Markdown text.
- Select save when you are done.
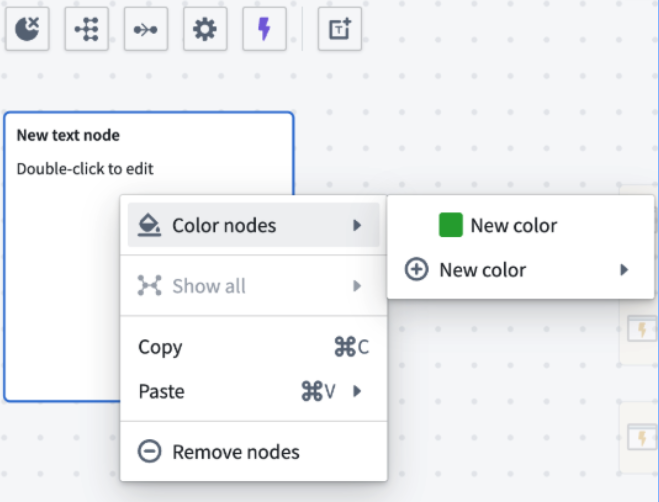
To color a text node, right click and select Color nodes. Choose a color or add a new color.
You can also resize text nodes using the three lines in the bottom right corner. If the length of your text is greater than the length of the text node, the node will automatically become scrollable.

Learn more about understanding workflows in Workflow Lineage.
Presentation mode
Presentation mode in Workflow Lineage lets you create and organize visual snapshots, or “frames”, of your graph for a seamless way to present you workflow.
:::callout{theme="neutral"} You must save your graph before you can use the presentation tool. :::
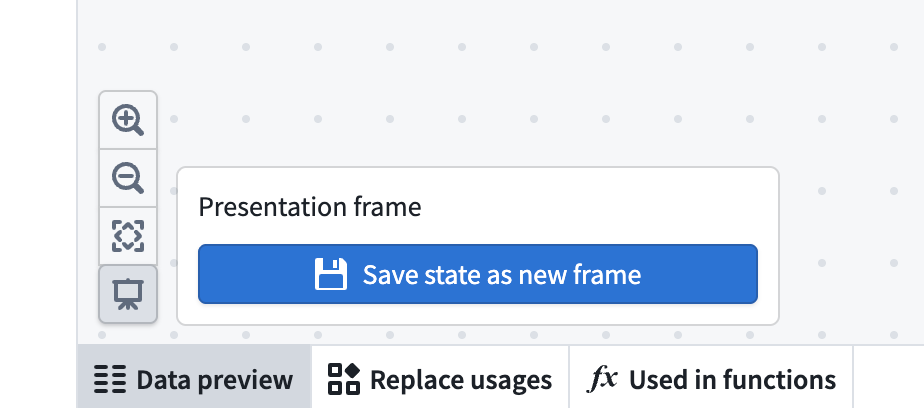
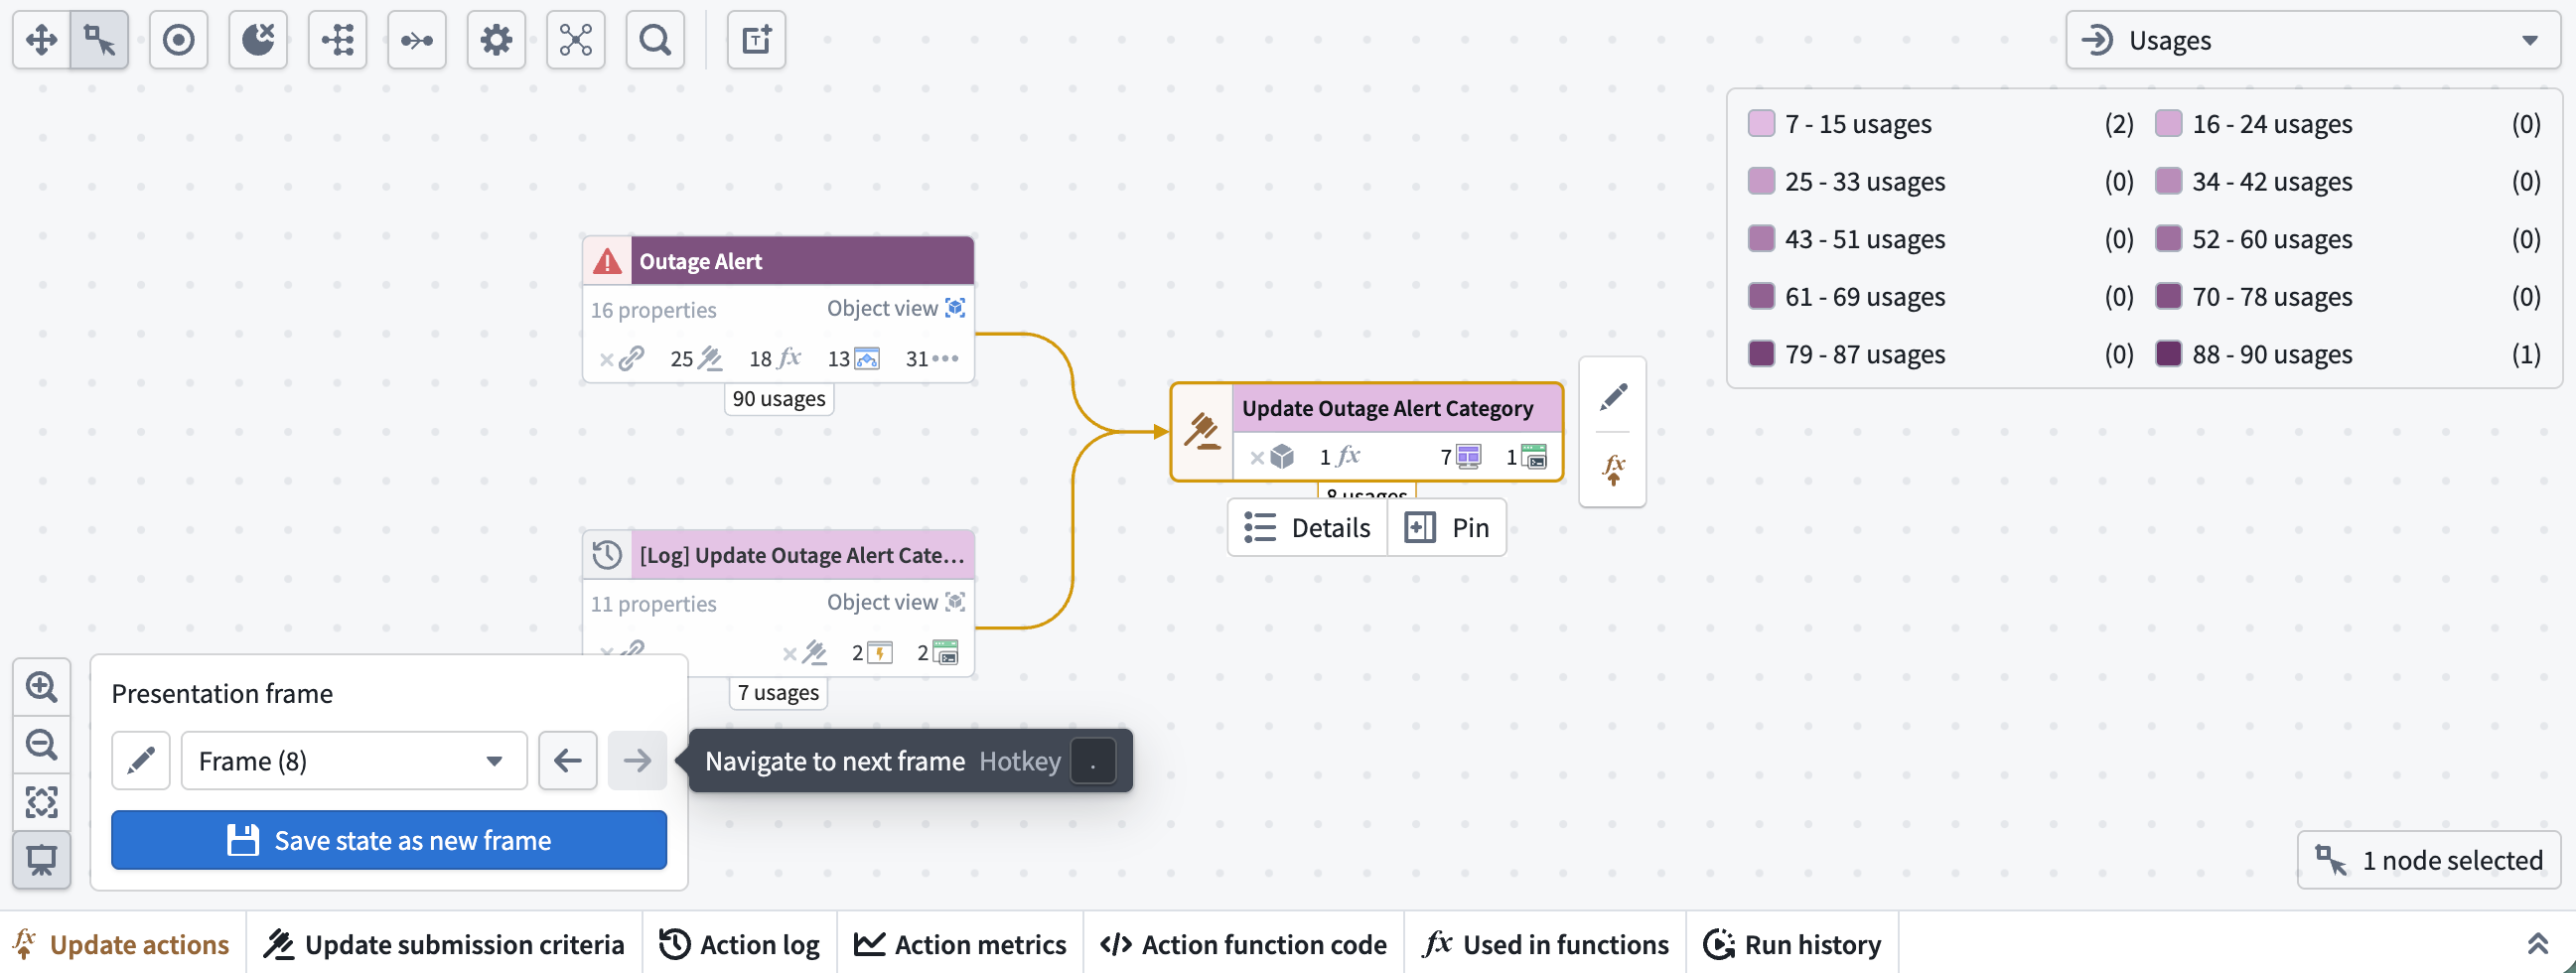
To create a frame, adjust your graph to capture the desired configuration. This can include the arrangement of nodes, node colors, color mode, and zoom level. Once you are satisfied with the current view, select Save state as new frame.
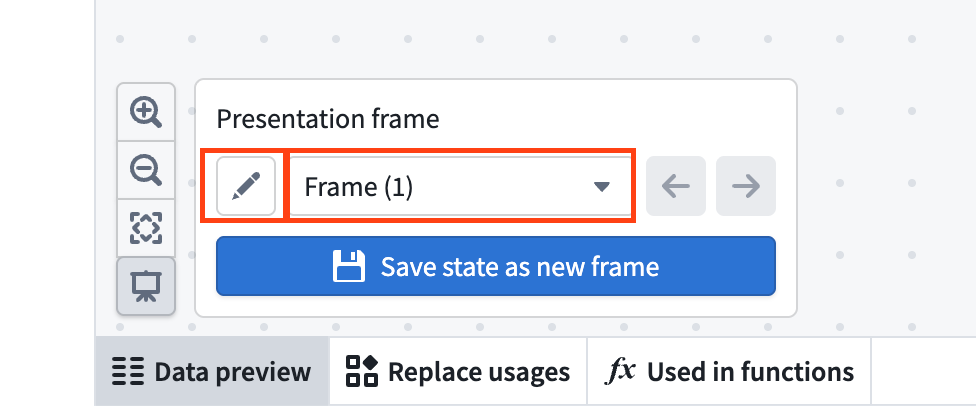
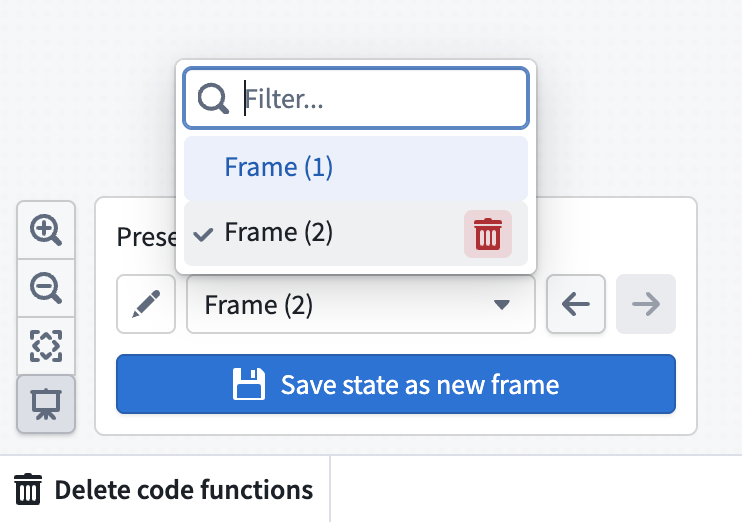
Each created frame will be given a default name such as “Frame (1),” “Frame (2),” and so on, based on the number of frames in your presentation. If you wish to rename a frame, select the pencil icon next to the frame’s name and enter your preferred title.
It is not currently possible to edit an existing frame directly. If you need to update a frame, adjust your graph as needed, save the new state as a new frame, and delete the old frame. To delete a frame, select the dropdown of all frames, and hover over the frame you want to delete. Then, select the red trashcan icon.
Note that presentation mode only captures the graph interface. Elements such as the Workshop side panel and the bottom and left side panels are not included in saved frames. You can use the hotkeys , and . to go backwards and forwards through your presentation frames, respectively.
:::callout{theme="neutral"} Tip: Use text nodes in your presentation frames. This allows you to guide viewers through each step of your workflow with custom notes or explanations. :::
中文翻译
入门指南
要开始使用工作流血缘分析(Workflow Lineage),请使用键盘快捷键 Cmd + i(macOS)或 Ctrl + i(Windows)查看工作流血缘关系图,该图展示了支撑您资源的对象、操作和函数。您也可以从以下应用程序中,通过通常位于 文件(File) 或 操作(Actions) 下的 在工作流血缘分析中打开(Open in Workflow Lineage) 导航选项,进入工作流血缘分析。
以下应用程序支持这些功能:
- Workshop
- 本体管理器(Ontology Manager)中的对象(Objects)
- 函数仓库(Function repositories)
- Quiver 仪表板(Quiver dashboards)
- Machinery
- Slate
- Chatbot Studio
- Automate
- 第三方应用程序
- 开发者控制台(Developer Console)(仅限键盘快捷键)
- Marketplace(仅限键盘快捷键,在草稿资源的概览选项卡中)
- Notepad(仅限导航选项)
- Pipeline Builder 中的对象类型(Object types)(仅限导航选项)
界面
工作流血缘分析的界面由两个主要组件构成,如下面的示意图所示:
- 图形面板(Graph panel): 一个交互式图形视图,展示支撑您工作流的实体及其之间的关系。
- Workshop 面板(Workshop panel): 所选 Workshop 应用程序的交互式视图。
图形面板
当您在图形面板上选择节点时,可以在 Workshop 面板上看到相应的 Workshop 组件被高亮显示。这使得您可以轻松查看使用特定节点的确切位置,并有助于显示特定对象的使用位置。
当您在图形上选择特定节点时,可以使用 固定(Pin) 选项将其固定到左侧边栏,或查看有关该节点的更多详细信息。
要查看特定节点的所有链接依赖项,请选择图形上您想要查看的输入类型对应的图标。
您可以在图形面板右上角的图例中查看每种节点类型的图标。对象类型节点使用本体(Ontology)中指定的图标表示。
在下面的示例中,我们希望查看依赖于 Outage Alert 对象的九个操作。选择对象上相同的内联图标位置,可以显示或隐藏这些依赖项。
通过选择节点,然后打开屏幕左侧的选择详情面板,可以查看特定节点的详细信息。显示的详细信息根据所选节点的类型而异。以下是可为每种资源找到的示例详细信息列表:
- 对象(Objects): 属性列表、这些属性在工作流中的使用位置(请参阅下面链接的属性溯源)、链接关系、底层数据源等。
- 对象链接(Object links): 对象、函数、操作、Workshop 应用程序等对资源的引用情况。
- 函数(Functions): 输入、输出、依赖项、仓库及其他相关元数据。
- 操作(Actions): API、RID、输入数据、本体编辑和提交标准。
- AIP 逻辑函数(AIP Logic functions): 依赖项、自动化以及创建细节的元数据。
- 语言模型(Language models): 模型描述以及关于模型创建者和上下文窗口的元数据。
- Workshop 应用程序(Workshop applications): 关于创建、操作、函数和对象依赖项的元数据。
支持多个本体
工作流血缘关系图显示来自所有相关本体的资源,使您能够可视化跨本体的关系。
如果某个对象、接口或操作节点属于不同的本体,该节点将显示为灰色,并且节点右上角会出现一个警告图标。
:::callout{theme="neutral"} 当您选择与自身不同的本体时,操作类型节点和对象节点的功能将受限。例如,您只能在当前选定的本体内对函数支持的操作(function-backed actions)执行批量更新。 :::
如果存在多个本体,图形右上角的蓝色立方体旁边也会出现一个警告图标。虽然您一次只能选择一个本体,但您可以通过选择立方体图标来查看图形中存在的本体并在它们之间切换。
其他详细信息
对于 函数(Functions),您可以在选择节点时查看代码。这包括您的函数从中读取数据的对象以及逻辑描述。您还可以批量升级 Workshop 应用程序中使用的函数。
对于 操作(Actions),您可以查看操作函数代码、操作日志,以及升级操作的选项。您还可以批量更新操作的提交标准以及批量删除操作和对象。
对于 对象(objects),您可以预览对象数据。您还可以批量删除操作和对象。
:::callout{theme="warning"}
默认情况下,表示对象链接和作为操作输入的对象之间的连线不会显示在图形上。要查看这些关系,请选择对象节点。您可以使用 macOS 上的 Cmd + A 和 Windows 上的 Ctrl + A 作为快捷键来选择所有节点。
:::
您还可以在 选择详情(Selection details) 面板的 链接(Links) 部分查看对象链接。将鼠标悬停在每个对象链接上,可以预览所有使用情况。
选择链接以查看完整详细信息。如果链接正在被编辑,相应的使用情况旁边会出现一个笔形图标。
这些链接也会作为依赖项显示在下游资源中。
对于 自动化(Automations),您可以在 选择详情(Selection details) 侧边栏中查看属性使用情况和依赖项。在 条件本体依赖项(Condition ontology dependencies) 下,您可以查看自动化条件所依赖的特定对象属性的细分。将鼠标悬停在数字上可以查看确切的属性。
您还可以切换图形左上角的紫色闪电按钮,以查看触发自动化的操作和函数。
如果您有一个在属性为特定值时触发的自动化,工作流血缘分析将找到将该属性编辑为该值的操作或函数,并将它们链接到该自动化。
Workshop 面板
在 Workshop 面板上,您可以选择不同的组件,并查看工作流血缘关系图上相应的高亮节点。
在 Workshop 面板底部,实体(Entities) 部分显示了应用程序中使用的所有支撑对象和操作。当您选择特定实体时,可以查看该实体在 Workshop 应用程序中的确切使用位置。
如果您的图形上有多个 Workshop 应用程序,您可以使用顶部的下拉菜单在 Workshop 应用程序视图之间切换。
要重新打开 Workshop 面板,请选择图形上的任何 Workshop 应用程序并按 I 键,或双击该节点。
颜色图例选项
工作流血缘分析提供了一套颜色图例系统,以帮助管理安全性并查看特定应用程序的元数据。颜色图例示例如下:
常规
- 节点类型(Node type): 显示图形上每个节点所代表的资源类型。
- 自定义颜色(Custom color): 通过右键单击节点创建新的颜色组、选择现有颜色组或将图例中的颜色拖放到节点上,向图例中添加颜色。
权限
使用情况
- 使用情况(Usages): 根据 Workshop 应用程序在过去四周内(包括查看和编辑模式)的浏览次数为其着色。
- 过时函数(Out of date functions): 请参阅操作支持函数升级部分。
- 应用程序视图(Application views): 根据 Workshop 应用程序在过去四周内(包括查看和编辑模式)的浏览次数为其着色。
- 模型使用情况(Model usage): 请参阅 AIP 使用指标部分。
- 本体状态(Ontology status): 根据
Active、Experimental、Deprecated、Example和Promoted状态为节点着色。 - 操作规则(Action rule): 根据节点是运行函数、创建、修改或删除对象,还是执行上述操作的组合来为其着色。
- 自动化过期(Automation expiration): 根据自动化节点的过期日期为其着色。
- 最后修改时间(Last modified): 根据节点的最后修改日期为其着色。
组织
- 文件夹(Folder): 根据每个节点所在的文件夹为其着色。
- 项目(Project): 根据每个节点所在的项目为其着色。
- 投资组合(Portfolio): 根据每个节点所在的投资组合为其着色。
- 函数仓库(Functions repository): 根据每个函数节点所在的函数仓库为其着色。
文本节点
您可以在工作流血缘分析中添加文本节点,以帮助记录和提醒图形中的细节。文本节点使用 Markdown 语法 ↗,并且可以像常规节点一样着色。它们不受布局选项的影响,也不附加到图形上的任何特定节点。
- 要向图形添加文本节点,请选择图形左上角的 文本(Text)。
- 双击文本节点进行编辑并添加 Markdown 文本。
- 完成后选择 保存(save)。
要为文本节点着色,请右键单击并选择 为节点着色(Color nodes)。选择一种颜色或添加新颜色。
您还可以使用右下角的三条线来调整文本节点的大小。如果文本长度大于文本节点的长度,节点将自动变为可滚动。
演示模式
工作流血缘分析中的演示模式允许您创建和组织图形的可视化快照(即“帧”),从而以无缝的方式展示您的工作流。
:::callout{theme="neutral"} 您必须先保存图形,然后才能使用演示工具。 :::
要创建帧,请调整您的图形以捕获所需的配置。这可以包括节点的排列、节点颜色、颜色模式和缩放级别。当您对当前视图满意后,选择 将状态保存为新帧(Save state as new frame)。
每个创建的帧将根据演示中的帧数获得一个默认名称,例如“帧 (1)”、“帧 (2)”等。如果您想重命名帧,请选择帧名称旁边的铅笔图标并输入您想要的标题。
目前无法直接编辑现有帧。如果您需要更新帧,请根据需要调整图形,将新状态保存为新帧,然后删除旧帧。要删除帧,请选择所有帧的下拉菜单,将鼠标悬停在要删除的帧上,然后选择红色垃圾桶图标。
请注意,演示模式仅捕获图形界面。诸如 Workshop 侧面板以及底部和左侧面板等元素不包含在保存的帧中。您可以使用热键 , 和 . 分别向后和向前浏览演示帧。
:::callout{theme="neutral"} 提示:在演示帧中使用文本节点。这使您可以通过自定义注释或解释来引导查看者完成工作流的每一步。 :::