Analyze user activity metrics(分析用户活动指标)
Understanding how your content is being used can help you demonstrate impact and prioritize your efforts. For example, usage metrics may reveal that a report is accessed daily across the organization, which could indicate high value, or the metrics could show that a dashboard is rarely viewed and could benefit from revision or removal.
These insights can help you allocate your time and resources more effectively by focusing on the content that matters most. They can also help you identify areas where additional training or communication may be needed to increase engagement with certain resources.
The Palantir platform provides organization-level metrics on platform-wide and resource-specific usage, enabling administrators to track adoption over time across defined usage cohorts. For more information on group management, refer to Authentication.
Permission and navigation
There are two views of usage metrics, with different access paths:
- Platform usage tab (organization-wide aggregated metrics): available to any user holding the View usage metrics workflow on the organization. By default, this workflow is assigned to the
Organization AdministratorandOrganization Settings Viewerroles. - Resource usage tab (per-resource metrics): a user sees metrics for a given resource if either of the following is true:
- They have
Ownerpermissions on that specific resource, or - They hold the View usage metrics workflow on the organization that owns the resource. In this case, they can view resource usage for every resource in the organization, not just those they own.
To grant a user access to both views without making them an administrator, an Organization Administrator can assign the View usage metrics workflow to an existing or newly created role, and then add the user to that role. For general information on access, refer to the Enrollments and organizations permissions documentation.
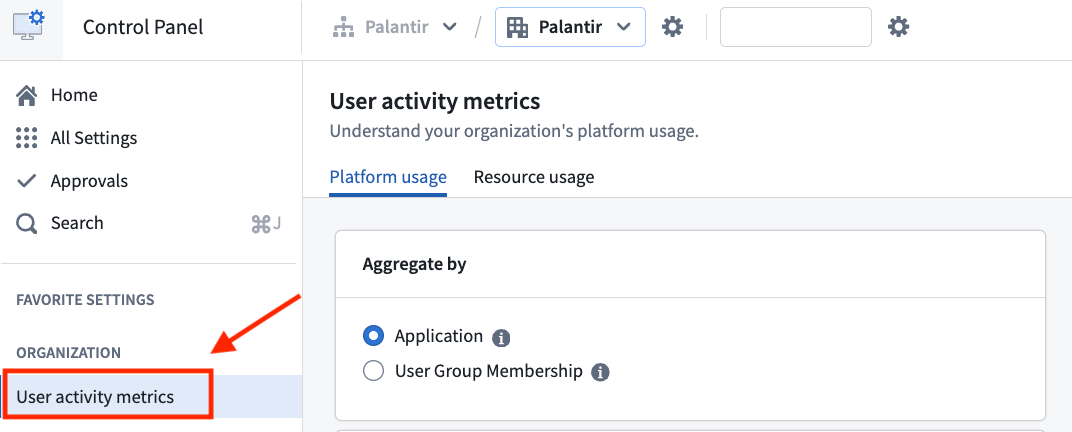
The User activity metrics dashboard can be found on Control Panel under Organization.
Platform usage
:::callout{theme="warning"} The dashboard provides only aggregated usage metrics by default. To get access to individual usage metrics, refer to Exporting User Activity Metrics below. :::
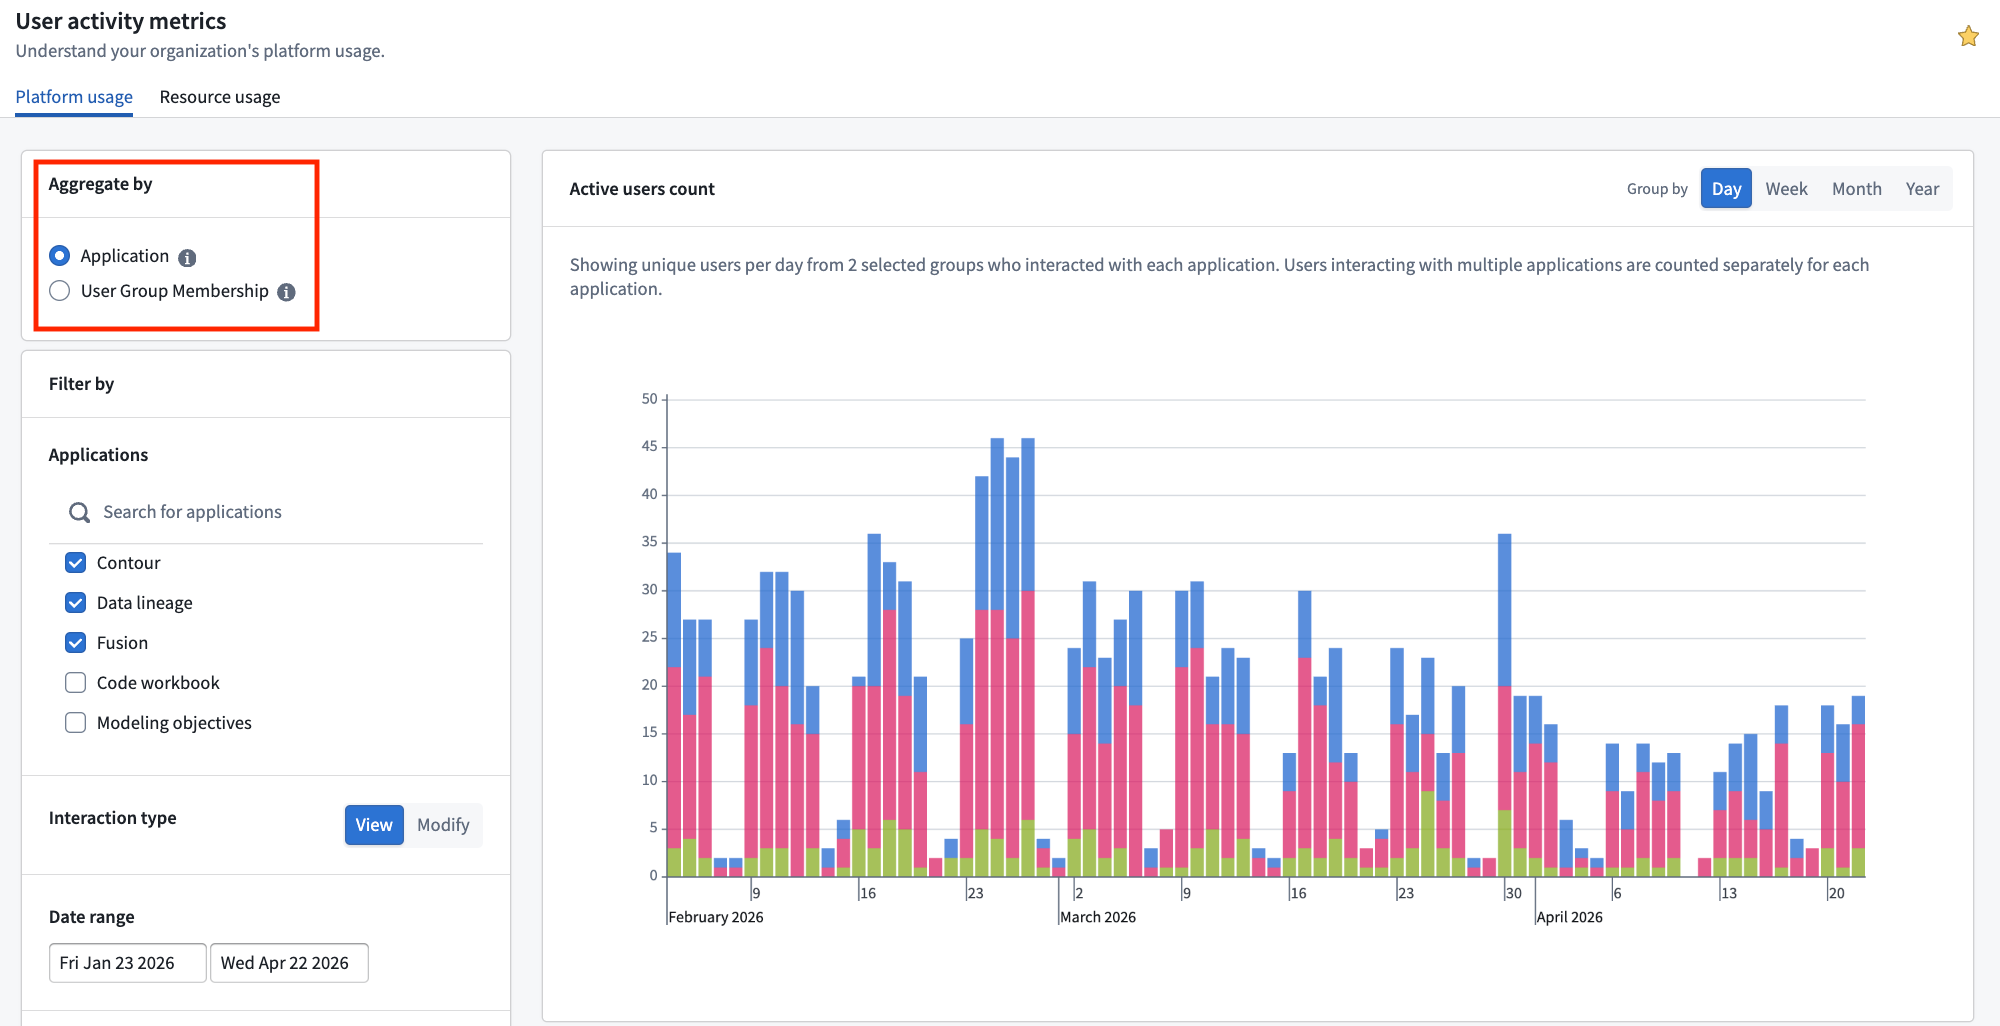
By default, this view provides a high-level usage count across the organization. The usage count indicates the number of unique users per day who have visited your organization's platform for any amount of time.
Grouping usage metrics
Usage metrics can be grouped by:
- Applications/Resources: When user counts are grouped by
Applications/Resources, the bars in the bar chart will be color-coded by application. - User group membership: When user counts are grouped by
User group membership, the bars in the bar chart will be color-coded by both the application's usage and user groups (for example, all users of a given group leveragingContourwill have a dedicated color).
:::callout{theme="warning"} When a user group does not meet the minimum of 10 interactions for the selected date range, the information will be suppressed and will not be represented in the resulting bar chart. :::
Filtering usage metrics
Usage metrics can be filtered by:
- Applications/Resources:
Workspaceis checked by default, but you can select any other application installed on your instance, such asWorkshop,Slate, orContour. - Interaction type: View and Modify
- View: Corresponds to the number of times an application has been opened. Every user that has made a
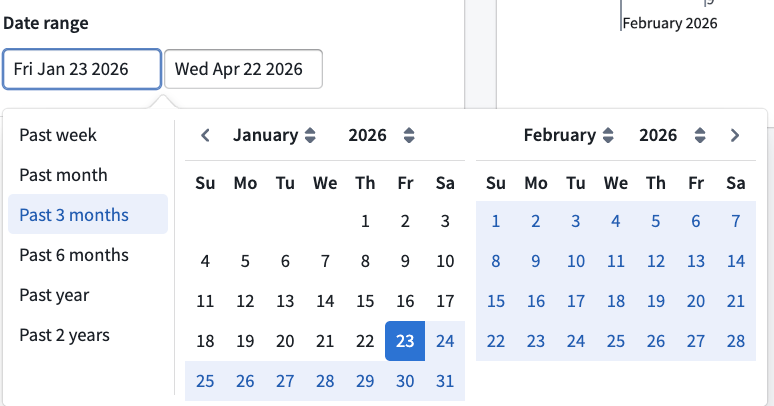
Modifyinteraction is automatically counted in theViewcount. Modifycorresponds to the number of times an application has been edited. Note thatEditevents do not exist for all application types (for example, Data Lineage).- Date Range: You may choose any time frame of your choosing or select any of the predefined options located on the left-hand side of the panel.
- Limit to user groups: By default,
Only my groupswill be checked. However, any user with the correct permissions will be able to query and select any other group within your own organization, as well as organizations for which you are a guest. However, these two conditions need to be met: - The user group must have at least 10 members; otherwise, the dashboard will not display user activity metrics.
- There must be at least 10 interactions in which the resource was viewed within the selected date range.
Examples of using the platform user activity dashboard view
- Comparing adoption rates: Use the dashboard to compare application adoption rates between two user groups, which may represent different manufacturing plants, departments, or teams.
- Identifying Development Trends: Track development trends as new tools are introduced to the platform. For instance, you might expect the number of users with a "Modify" interaction type to decrease over time as workflows reach a steady state.
Resource usage
The Resource Usage view allows users to monitor the usage over time of specific resources (for example, Workshop applications) to which they have access. This view shares all the grouping and filtering features mentioned in the platform usage view, but includes an additional filter: Resource.
To use this filter, users will need to:
- Select an Application from the dropdown menu.
- Choose the corresponding Resource from the organization's directory.
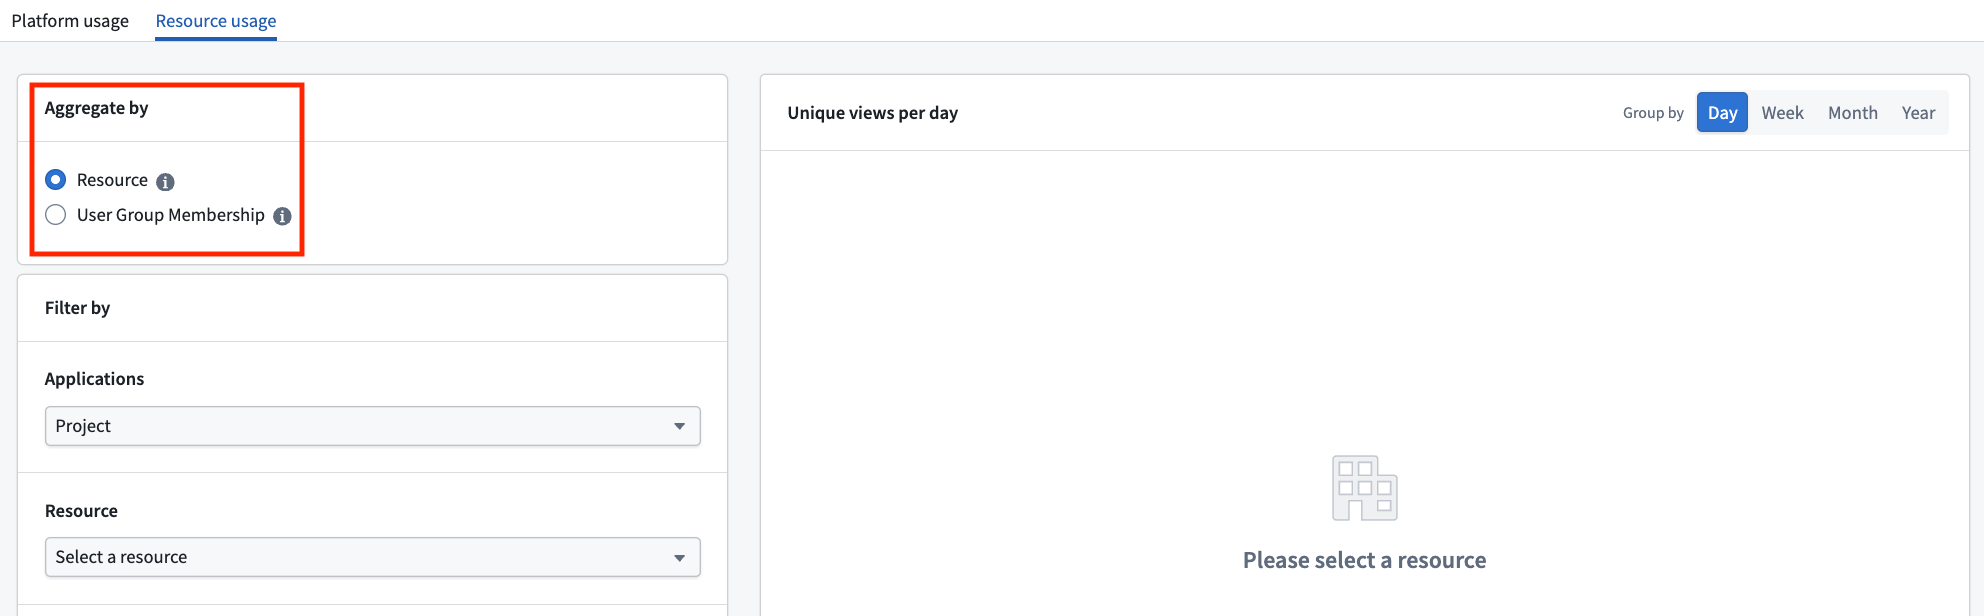
:::callout{theme="warning"} Under Application, the Project option allows Administrators to track user interactions with a specific project. Organizations often use projects as proxies for different teams or workflows. As a result, this option enables users to monitor the total amount of Palantir platform activity across various initiatives. :::
Exporting user activity metrics
Some organizations may be interested in analyzing raw user activity metrics in greater depth. Internal datasets are sensitive and should only be accessed by authorized personnel in accordance with all applicable laws. Palantir recommends that any exported dataset be appropriately permissioned — for instance, by applying a marking to the project. Processing of exported data is subject to Palantir's Acceptable Use Policy ↗. Refer to Internal dataset exports in the documentation to learn more.
中文翻译
分析用户活动指标
了解内容的使用情况有助于展示影响力并确定工作优先级。例如,使用量指标可能显示某个报告在整个组织内被每日访问,这可能表明其具有高价值;或者指标可能显示某个仪表板很少被查看,需要进行修订或移除。
这些洞察可以帮助您更有效地分配时间和资源,专注于最重要的内容。它们还可以帮助您识别需要额外培训或沟通的领域,以提高对某些资源的参与度。
Palantir平台提供组织级别的指标,涵盖平台范围及特定资源的使用情况,使管理员能够跟踪定义的使用群体随时间推移的采用趋势。有关群组管理的更多信息,请参阅身份验证(Authentication)。
权限与导航
使用量指标有两种视图,具有不同的访问路径:
- 平台使用量(Platform usage) 标签页(组织范围聚合指标):适用于持有组织查看使用量指标(View usage metrics) 工作流的任何用户。默认情况下,此工作流分配给
组织管理员(Organization Administrator)和组织设置查看者(Organization Settings Viewer)角色。 - 资源使用量(Resource usage) 标签页(按资源指标):用户可在以下任一条件下查看特定资源的指标:
- 他们对特定资源拥有
所有者(Owner)权限,或 - 他们持有拥有该资源的组织的查看使用量指标(View usage metrics) 工作流。在这种情况下,他们可以查看组织中每个资源的使用量,而不仅仅是他们拥有的资源。
要授予用户对两个视图的访问权限而不使其成为管理员,组织管理员(Organization Administrator)可以将查看使用量指标(View usage metrics) 工作流分配给现有或新创建的角色,然后将用户添加到该角色。有关访问权限的一般信息,请参阅注册与组织权限文档。
用户活动指标仪表板可在控制面板(Control Panel) 的组织(Organization) 下找到。
平台使用量
:::callout{theme="warning"} 仪表板默认仅提供聚合使用量指标。要获取个人使用量指标,请参阅下方的导出用户活动指标。 :::
默认情况下,此视图提供组织范围内的高级使用量计数。使用量计数表示每天访问组织平台任意时长的独立用户数量。
分组使用量指标
使用量指标可按以下方式分组:
- 应用程序/资源(Applications/Resources): 当用户计数按
应用程序/资源分组时,条形图中的条形将按应用程序进行颜色编码。 - 用户组成员身份(User group membership): 当用户计数按
用户组成员身份分组时,条形图中的条形将按应用程序使用情况和用户组进行颜色编码(例如,使用Contour的特定组的所有用户将拥有专用颜色)。
:::callout{theme="warning"} 当用户组在选定日期范围内未达到最少10次交互时,相关信息将被隐藏,不会在生成的条形图中显示。 :::
筛选使用量指标
使用量指标可按以下方式筛选:
- 应用程序/资源(Applications/Resources): 默认选中
工作区(Workspace),但您可以选择实例上安装的任何其他应用程序,例如Workshop、Slate或Contour。 - 交互类型(Interaction type): 查看(View)和修改(Modify)
- 查看(View): 对应应用程序被打开的次数。每个进行过
修改(Modify)交互的用户都会自动计入查看(View)计数。 - 修改(Modify): 对应应用程序被编辑的次数。请注意,并非所有应用程序类型都存在
编辑(Edit)事件(例如,数据沿袭(Data Lineage))。 - 日期范围(Date Range): 您可以选择任意时间段,或选择面板左侧的预定义选项。
- 限制到用户组(Limit to user groups): 默认情况下,会选中
仅我的组(Only my groups)。然而,任何具有正确权限的用户都可以查询并选择自己组织内的任何其他组,以及您作为访客所在的组织。但需满足以下两个条件: - 用户组必须至少有10名成员;否则,仪表板将不会显示用户活动指标。
- 在选定的日期范围内,必须至少有10次资源被查看的交互。
使用平台用户活动仪表板视图的示例
- 比较采用率: 使用仪表板比较两个用户组之间的应用程序采用率,这些用户组可能代表不同的制造工厂、部门或团队。
- 识别开发趋势: 随着新工具引入平台,跟踪开发趋势。例如,随着工作流达到稳定状态,您可能预期具有"修改(Modify)"交互类型的用户数量会随时间减少。
资源使用量
资源使用量(Resource Usage)视图允许用户监控其拥有访问权限的特定资源(例如Workshop应用程序)随时间的使用情况。此视图共享平台使用量视图中提到的所有分组和筛选功能,但增加了一个额外筛选器:资源(Resource)。
要使用此筛选器,用户需要:
- 从下拉菜单中选择一个应用程序(Application)。
- 从组织目录中选择相应的资源(Resource)。
:::callout{theme="warning"} 在应用程序(Application)下,项目(Project)选项允许管理员跟踪用户与特定项目的交互。组织通常将项目用作不同团队或工作流的代理。因此,此选项使用户能够监控跨各种计划的Palantir平台活动总量。 :::
导出用户活动指标
某些组织可能希望更深入地分析原始用户活动指标。内部数据集是敏感的,只能由授权人员根据所有适用法律进行访问。Palantir建议对任何导出的数据集进行适当的权限设置——例如,通过向项目应用标记(marking)。导出数据的处理受Palantir可接受使用政策 ↗约束。请参阅文档中的内部数据集导出了解更多信息。