View build timeline(查看构建时间线(Build timeline))
Use the Build timeline tool in Data Lineage to view the build history of your datasets.
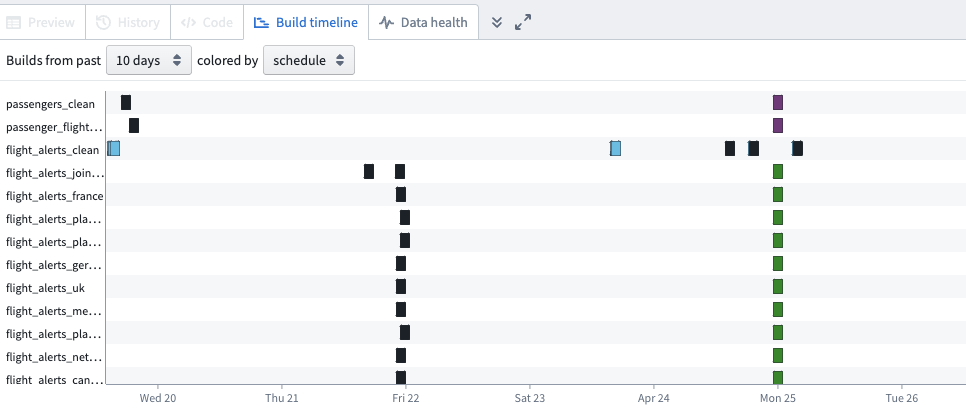
In Data Lineage, click on Build timeline in the bottom left of your window. This action expands the view panel to display a Gantt chart of builds that took place during the period of time of your choice. You can select the number of days or hours you would like to view in your timeline, ranging from one hour to ten days. You can also choose to display the builds by color based on schedule or job status.
To view the build timeline of a specific dataset, select the dataset on your graph. Select multiple datasets with the Drag select mode tool or by holding Ctrl / Command while clicking.
To view details of a job in the build timeline, click on the job in the Gantt chart. You will see information about the job status, start and end time, and duration.
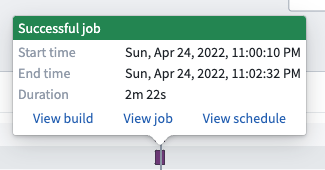
See more details about the build, job, and schedule by clicking on the links within the job information window.
中文翻译
查看构建时间线(Build timeline)
使用数据血缘(Data Lineage)中的构建时间线(Build timeline)工具查看数据集(dataset)的构建历史。
在数据血缘中,点击窗口左下角的构建时间线。此操作会展开查看面板,展示你选定时间范围内所有构建的甘特图(Gantt chart)。你可以选择时间线的展示时长,可选范围从1小时到10天不等。你也可以选择基于调度(schedule)或任务状态(job status)为不同构建分配显示颜色。
要查看特定数据集的构建时间线,请在图谱中选中该数据集。你可以使用框选模式(Drag select mode)工具,或是按住Ctrl / Command点击,实现多数据集批量选中。
要查看构建时间线中某个任务(job)的详情,请点击甘特图中的对应任务,你将看到任务状态、起止时间、运行时长等相关信息。