Navigation(导航)
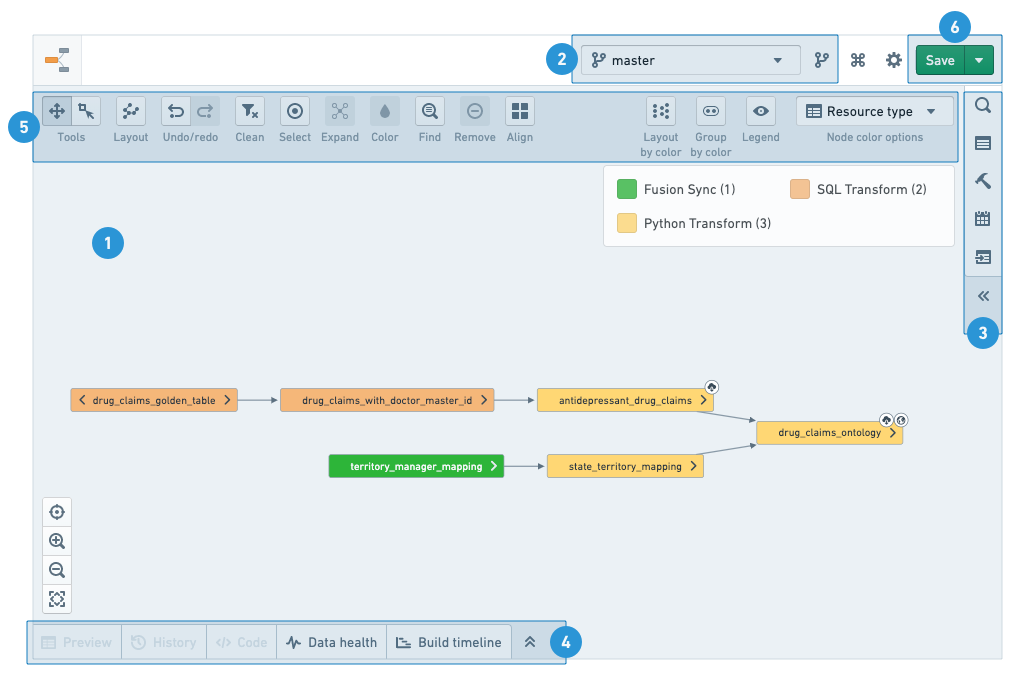
To make the best use of the Data Lineage application, you will need to know how to navigate the graphs, use tools, and configure branch and graph properties. The following numbered sections correspond to the numbers on the screenshot below:
- Lineage graph
- Branch settings
- Side panel
- Search & Browse
- Properties and Histogram
- Manage Builds
- Manage Schedules
- Related Artifacts
- Node details panel
- Graph tools
- Save graph
Lineage graph
The graph is your workspace for arranging and manipulating nodes as you explore your data pipeline.
After adding nodes to the graph, you can add their related resources by clicking on the arrows on either side of the node or by using the Expand option in the graph tools.
Nodes are arranged with auto-layout by default, but you can rearrange nodes manually by clicking and dragging them. To re-enable auto-layout, choose Layout all nodes under the Layout option in the graph tools.
Click and drag to pan around the graph when in the default Panning mode. To use the cursor to select multiple nodes, switch to Drag select mode in the graph tools or hold Shift while clicking and dragging. You can select a node by clicking it, or select multiple nodes with Ctrl/Cmd + click.
Branch settings
Select a branch from the list to explore data pipelines in that branch. The graph and any of the other helpers would show information based on the selected branch. If the branch does not exist for a resource, the listed fallback branches would be used instead (in the order they appear on the list).
To learn more about branching, see the branching documentation.
Side panel
Search and browse
Use the search helper to find Foundry resources and add them to the graph. Use the free-text search or browse the tree to find resources. Add a resource by clicking on it or use the buttons at the bottom of the view to add all search results (including or excluding the content of sub-folders). Use the Advanced tab to add filters to your search and sort your results.
:::callout{theme="warning" title="Warning"} When viewing a folder with subfolders, you can recursively add all tables in all subfolders to the graph. Adding too many nodes at once may effect the graph's performance. :::
Properties and histogram
When you select a single node on the graph, the properties helper shows you the details of the resource. Depending on the type of resource you select, the properties helper shows available Foundry apps under the Actions menu and other links and actions (reporting issues, adding descriptions, etc.).
When you select multiple nodes on the graph, you will see the histogram helper. The helper displays common properties and their values alongside the number of appearances of each value on the graph. By clicking on the values, the matching nodes are highlighted. If you want to drill down to just those resources, click on Update selection.

:::callout{theme="success"} Use the Copy names button in the histogram to copy the names of all currently selected resources. The full names (including path) are copied to the clipboard as a comma-separated list. :::
Manage builds
The builds helper offers you three build strategies:
- Build only selected datasets
- Build all datasets between the selected datasets
- Build the selected datasets and all of their ancestors
Learn more about managing builds.
Manage schedules
The schedules helper allows you to set and edit build schedules for selected resources on the graph. Learn more about build schedules..
:::callout When viewing and creating schedules in Data Lineage, the schedules apply to the branches (including fallback branches) configured in the graph. :::
Related artifacts
The related artifacts helper displays artifacts directly linked to the nodes selected on the graph. Deleted and automatically saved files are excluded from the list unless chosen otherwise. You can also get to the same list of related artifacts by hovering over the right arrow of each node on the graph.
Node details
Click on a node to see more details:
- Preview: A sample of the data in the selected dataset.
- History: An overview of dataset change history. The overview includes tabs for logs, files, metadata, schema and job specifications.
- Code: If code was used to generate the dataset, it will display here
- Data Health: All the health checks set on the selected datasets.
- Build timelines: A Gantt chart of actual build time for the selected datasets.
Graph tools
The graph tools provide a set of graph exploration, navigation, and customization capabilities:
Node coloring
You can color the nodes on your lineage graph by several properties and metrics. Node coloring is commonly used to communicate lineage structure, troubleshoot issues, monitor pipelines health, and manage builds. You can also create your own custom coloring and arrange the graph based on the colors you assigned.
Read more about node coloring options.
:::callout{theme="success"} You can arrange your nodes on the graph by color group under Layouts. :::
Layout
The layout button provide various arrangement option for the nodes on the graph. Layout all nodes applies automatic layout for all the nodes on the graphs. When you select multiple nodes on the graph, you can apply other layouts (vertical, hierarchical, by level, etc.).
:::callout{theme="success"} You can use various useful keyboard shortcuts in the lineage graph. View the full list under the Keyboard shortcuts button at the top right corner of the app. :::
Expand
Use the Expand tool to expose ancestors and descendants of nodes in the graph. Learn more about exploring data lineage..
Find
Use Find to search for nodes on the graph. You can either search for the name of the node or column names in datasets.
Selection
The Selection tool allows you to easily select nodes on the graph:
- Select All: Selects all the nodes currently on the graph.
- Invert selection: De-selects all currently selected nodes and selects the rest of the nodes on the graph.
- Select children: Adds all the direct children of the currently selected nodes to your selection
- Select parents: Adds all the direct parents of the currently selected nodes to your selection.
Save graph
You can save and share your lineage graph with other Foundry users in the following ways:
- Save / Open: Save your Data Lineage graph and re-open it by clicking on Open graph.
- Get quick share link: Generates a shareable link that provides read-only access to your graph.
- Export graph to SVG: Generates a static image of your lineage graph.
:::callout Your branch choice is saved with your saved graph. If you load a graph with a different branch configuration than you currently have, you will be asked if you would like to switch branches to the saved branch configuration. :::
中文翻译
导航
为充分利用数据沿袭(Data Lineage)应用程序,您需要了解如何浏览图谱、使用工具以及配置分支和图谱属性。以下编号部分对应下方截图中的数字:
沿袭图谱
图谱是您探索数据管道时排列和操作节点的工作区。
将节点添加到图谱后,您可以点击节点两侧的箭头或使用图谱工具中的展开(Expand)选项来添加相关资源。
默认情况下,节点采用自动布局排列,但您也可以通过点击并拖动节点来手动重新排列。要重新启用自动布局,请在图谱工具的布局(Layout)选项中选择布局所有节点(Layout all nodes)。
在默认的平移模式(Panning mode)下,点击并拖动可平移图谱。要使用光标选择多个节点,请切换到图谱工具中的拖动选择(Drag select)模式,或按住Shift键同时点击并拖动。您可以点击选择单个节点,或使用Ctrl/Cmd + 点击选择多个节点。
分支设置
从列表中选择一个分支,以探索该分支中的数据管道。图谱和所有其他辅助工具将根据所选分支显示信息。如果某个资源不存在该分支,则将使用列表中列出的回退分支(按列表显示顺序)。
要了解更多关于分支的信息,请参阅分支文档。
侧面板
搜索与浏览
使用搜索辅助工具查找Foundry资源并将其添加到图谱中。使用自由文本搜索或浏览树形结构来查找资源。点击资源即可添加,或使用视图底部的按钮添加所有搜索结果(包括或排除子文件夹内容)。使用高级(Advanced)选项卡为搜索添加筛选条件并对结果进行排序。
:::callout{theme="warning" title="警告"} 查看包含子文件夹的文件夹时,您可以递归添加所有子文件夹中的所有表到图谱。一次性添加过多节点可能会影响图谱性能。 :::
属性与直方图
当您在图谱上选择单个节点时,属性辅助工具会显示该资源的详细信息。根据所选资源类型的不同,属性辅助工具会在操作(Actions)菜单下显示可用的Foundry应用程序以及其他链接和操作(如报告问题、添加描述等)。
当您在图谱上选择多个节点时,将看到直方图辅助工具。该工具会显示共同属性及其值,以及每个值在图谱上出现的次数。点击某个值,匹配的节点会被高亮显示。如果您只想深入查看这些资源,请点击更新选择(Update selection)。
:::callout{theme="success"} 使用直方图中的复制名称(Copy names)按钮可复制当前所有选中资源的名称。完整名称(包括路径)将以逗号分隔列表的形式复制到剪贴板。 :::
管理构建
构建辅助工具为您提供三种构建策略:
- 仅构建选定的数据集
- 构建选定数据集之间的所有数据集
- 构建选定数据集及其所有祖先数据集
管理调度
调度辅助工具允许您为图谱上选定的资源设置和编辑构建调度。 了解更多关于构建调度的信息。
:::callout 在数据沿袭(Data Lineage)中查看和创建调度时,调度将应用于图谱中配置的分支(包括回退分支)。 :::
相关工件
相关工件辅助工具显示与图谱上选定节点直接关联的工件。除非另行选择,否则已删除和自动保存的文件将从列表中排除。您也可以通过悬停在图谱上每个节点的右侧箭头上,获取相同的相关工件列表。
节点详情
点击节点可查看更多详细信息:
- 预览(Preview): 选定数据集中的数据样本。
- 历史(History): 数据集变更历史概览。概览包括日志、文件、元数据、模式和作业规范等选项卡。
- 代码(Code): 如果使用代码生成数据集,将在此处显示。
- 数据健康(Data Health): 选定数据集上设置的所有健康检查。
- 构建时间线(Build timelines): 选定数据集实际构建时间的甘特图。
图谱工具
图谱工具提供了一系列图谱探索、导航和自定义功能:
节点着色
您可以根据多种属性和指标为沿袭图谱上的节点着色。节点着色通常用于传达沿袭结构、排查问题、监控管道健康以及管理构建。您还可以创建自定义着色,并根据分配的颜色排列图谱。
:::callout{theme="success"} 您可以在布局(Layouts)下按颜色组排列图谱上的节点。 :::
布局
布局按钮为图谱上的节点提供多种排列选项。 布局所有节点(Layout all nodes) 对图谱上的所有节点应用自动布局。当您在图谱上选择多个节点时,可以应用其他布局(垂直、层次、按层级等)。
:::callout{theme="success"} 您可以在沿袭图谱中使用各种有用的键盘快捷键。在应用程序右上角的键盘快捷键(Keyboard shortcuts)按钮下查看完整列表。 :::
展开
使用展开(Expand)工具可显示图谱中节点的祖先和后继节点。了解更多关于探索数据沿袭的信息。
查找
使用查找(Find)可搜索图谱上的节点。您可以搜索节点名称或数据集中的列名。
选择
选择(Selection)工具允许您轻松选择图谱上的节点:
- 全选(Select All): 选择当前图谱上的所有节点。
- 反选(Invert selection): 取消选择当前所有选中的节点,并选择图谱上其余节点。
- 选择子节点(Select children): 将当前选中节点的所有直接子节点添加到选择中。
- 选择父节点(Select parents): 将当前选中节点的所有直接父节点添加到选择中。
保存图谱
您可以通过以下方式保存和与其他Foundry用户共享您的沿袭图谱:
- 保存/打开(Save / Open): 保存您的数据沿袭图谱,并通过点击打开图谱(Open graph)重新打开。
- 获取快速分享链接(Get quick share link): 生成一个可分享的链接,提供对您图谱的只读访问权限。
- 将图谱导出为SVG(Export graph to SVG): 生成沿袭图谱的静态图像。
:::callout 您的分支选择会随保存的图谱一起保存。如果您加载的图谱与当前分支配置不同,系统将询问您是否要切换到保存的分支配置。 :::