Analysis(分析)
Analyze usage, cost, and billing with the Analysis tab.
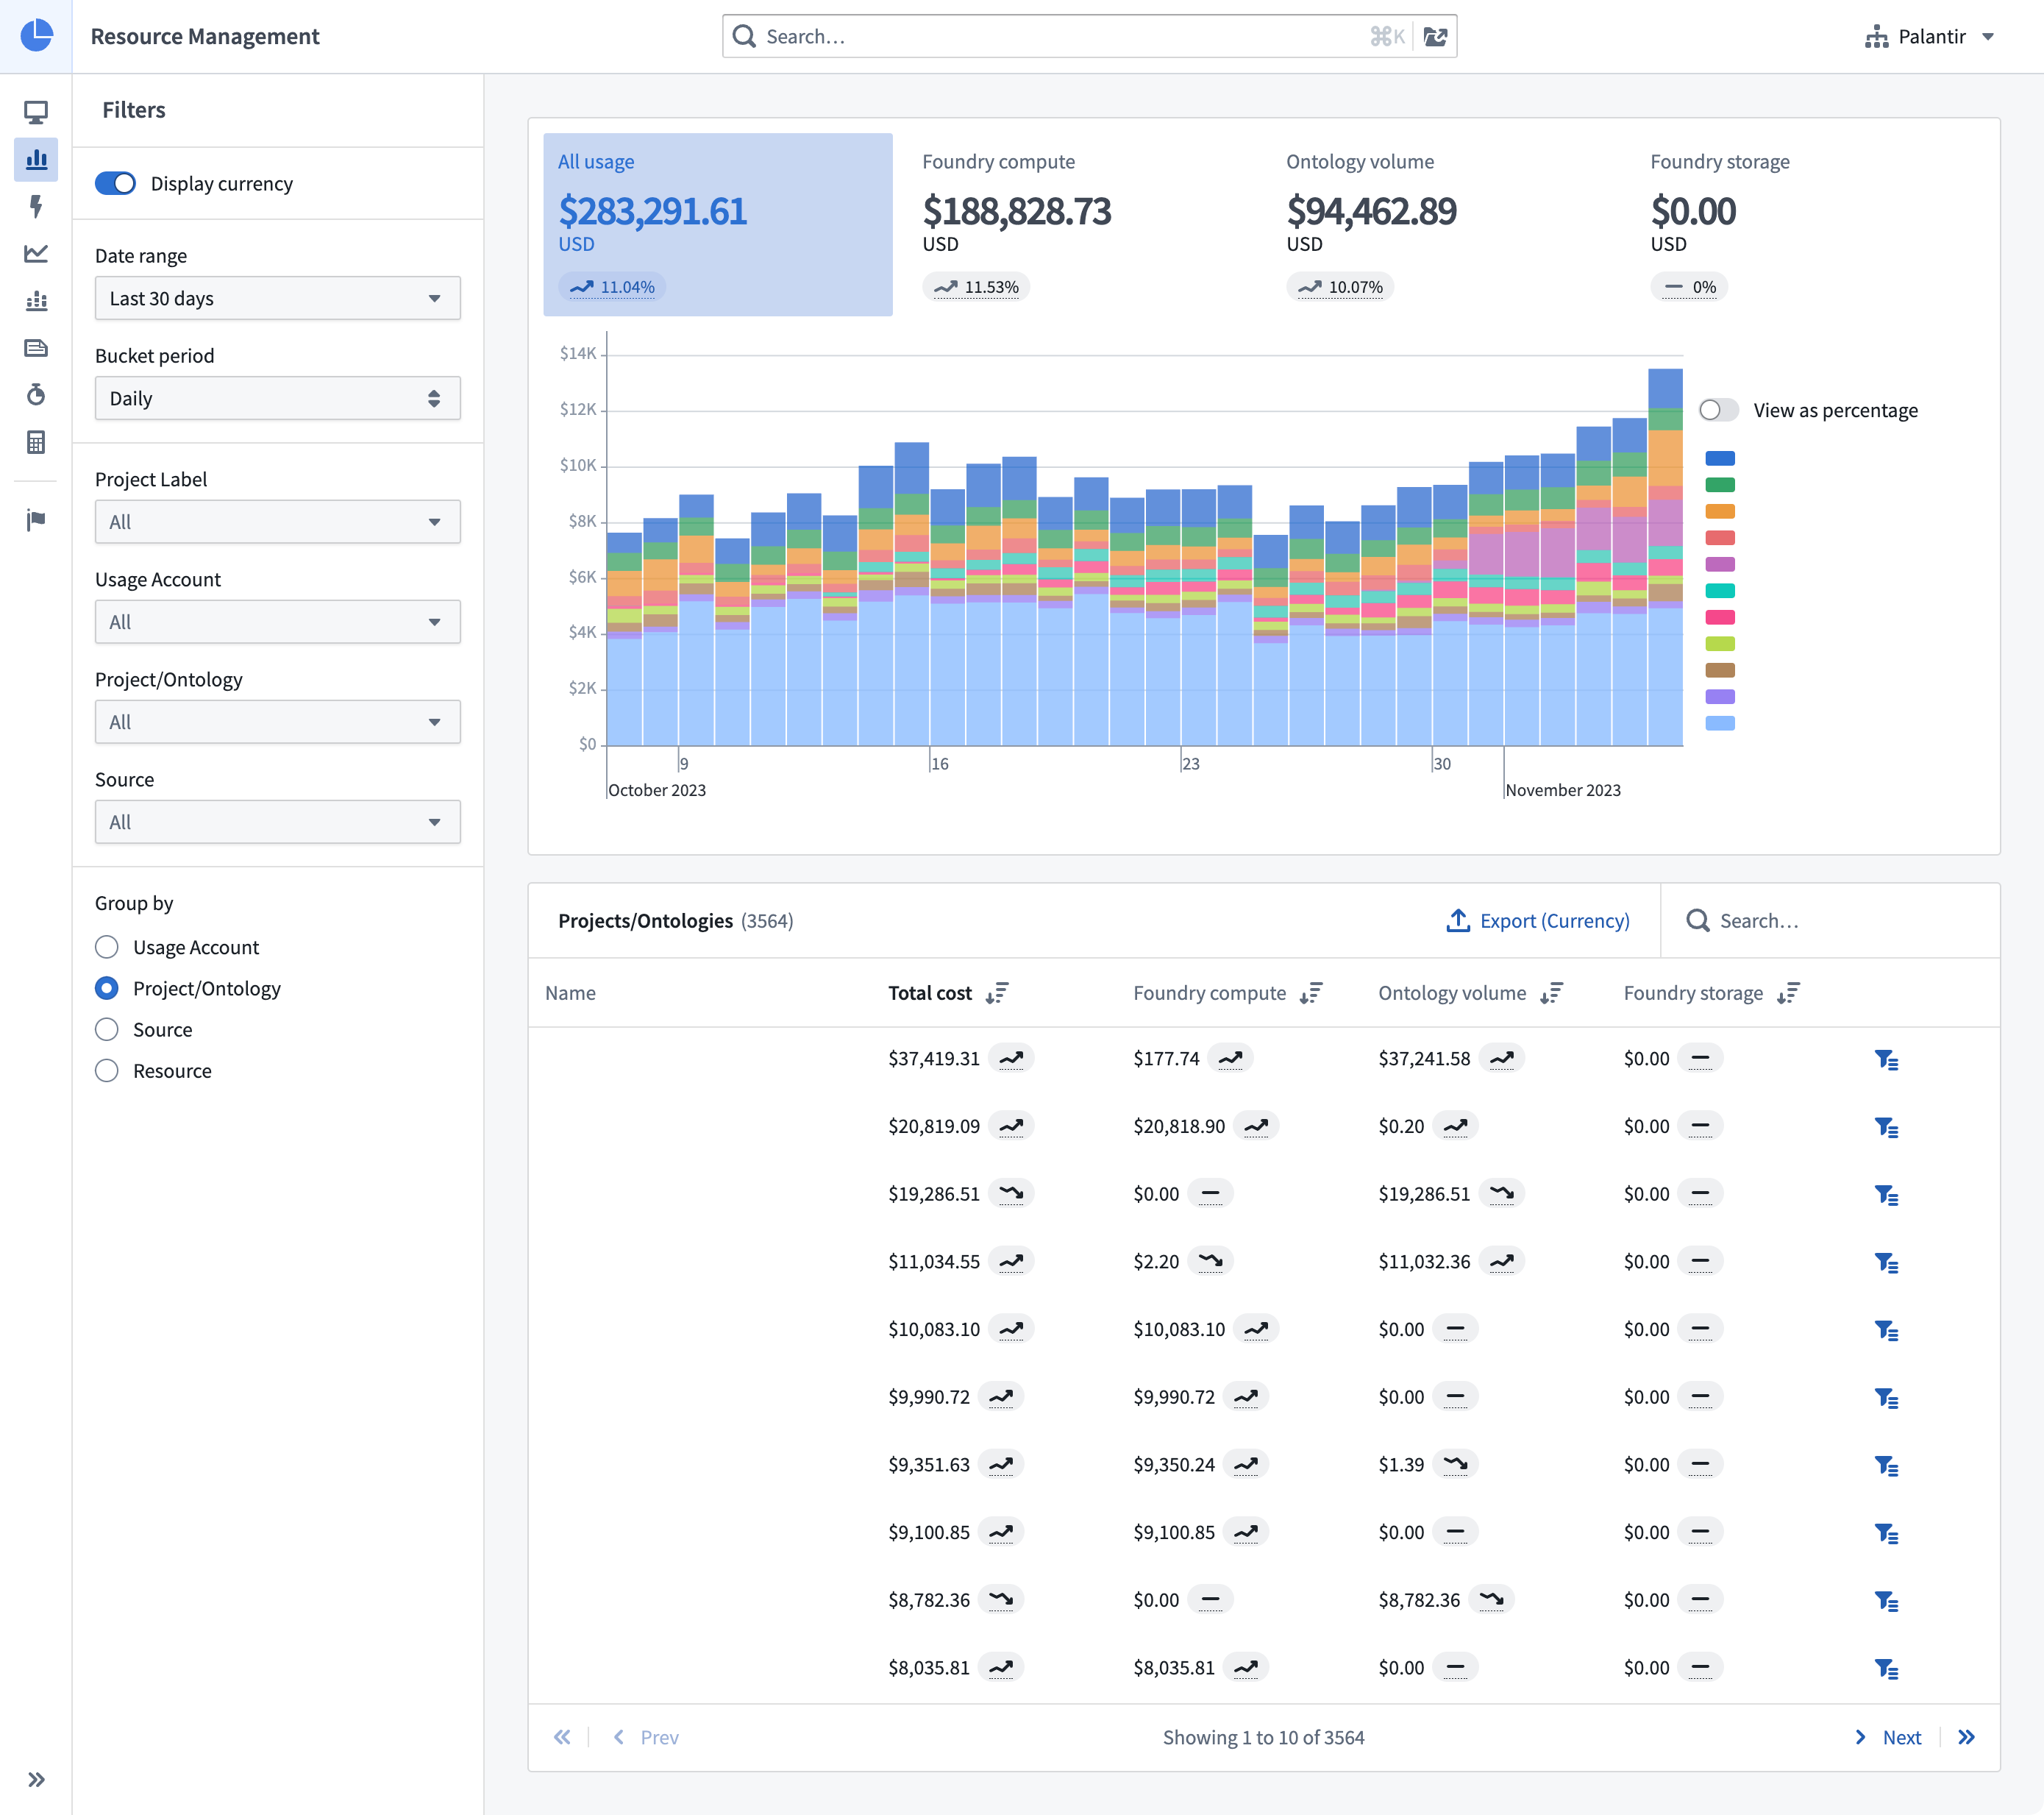
The Analysis tab in Resource Management gives users the opportunity to explore their usage data in more depth. Here, users can explore their usage by usage accounts, Project labels, Projects, Ontologies, sources, and more. Usage can be grouped together and explored in aggregate.
- Date range: The date range scopes the data displayed in the analysis to the specified date period. All dates and times are in UTC.
- Bucket period: How data is bucketed for display in the usage chart.
- Only complete buckets will be returned. Therefore, weekly or monthly bucket periods should only be used with aligned date ranges to ensure that the total usage values are correct.
- Data loading will be slower for daily bucket periods than for weekly or monthly bucket periods.
- Source: Specifying a source scopes the data displayed in the analysis to the specified source type. For example, if a user would like to see only usage coming from streaming, they could select Streaming.
- Filtering: Specifying a usage account, project label, Project, or Ontology scopes the data displayed in the analysis to that area of the data hierarchy.
- Group by: Specifying a grouping allows users to group the data presented in the analysis by the selected criteria.
All of these selection mechanisms work in tandem to refine an analysis to a user's desired set of data.
中文翻译
分析
通过"分析"选项卡,您可以深入了解使用情况、成本与账单。
Resource Management 中的分析选项卡让用户能够更深入地探索其使用数据。在此处,用户可按使用账户、项目标签、项目、本体、数据源等维度进行探索。使用数据可被分组并聚合查看。
- 日期范围: 将分析中显示的数据限定在指定日期范围内。所有日期和时间均采用 UTC 时间。
- 分桶周期: 数据在用量图表中显示时的分桶方式。
- 仅返回完整的分桶数据。因此,周或月分桶周期应仅与对齐的日期范围配合使用,以确保总用量值准确无误。
- 日分桶周期的数据加载速度会比周或月分桶周期慢。
- 数据源: 指定数据源可将分析中显示的数据限定为特定源类型。例如,若用户只想查看来自流式传输的使用数据,可选择流式传输。
- 筛选: 指定使用账户、项目标签、项目或本体,可将分析中显示的数据限定在数据层级结构的对应范围内。
- 分组依据: 指定分组条件后,用户可按所选标准对分析中呈现的数据进行分组。
所有这些选择机制协同作用,可将分析范围精确调整至用户所需的数据集。