Usage types(使用类型)
Resource Transparency reports can be viewed in the Resource Management App, where users can see a breakdown of compute and storage resources consumed by Projects and Ontologies.
Foundry compute
Foundry is a platform that runs computational work on top of data. This work is measured using Foundry compute-seconds. Compute-seconds represent a unit of computational work in the platform and are used by both batch (long-running) and interactive (ad-hoc) applications. These compute-seconds can be driven by a variety of factors, including the number of parallelized compute executors, the size of the compute executors, the size of the data being worked on, and the complexity of the computational job.
Many compute frameworks in Foundry operate in a "parallel" manner, which means multiple executors are working on the same job at the same time. Parallelization significantly speeds up the execution of most jobs but uses more compute-seconds per unit time.
Wall-clock time
An important term to define is wall-clock time. Wall-clock time, also known as elapsed real time, is the actual time taken for a process from start to point of measurement, as measured by a clock on the wall or a stopwatch. In other words, wall-clock time is the difference (in seconds) between the time at which a task started and the time at which the task finishes. It is important to note that many Foundry compute-seconds can be used per wall-clock second and that different job types use compute-seconds at different rates, depending on their configuration.
A useful analogy for wall-clock time versus Foundry compute-seconds is the concept of human hours. Two people who each work 8-hour work days produce 16 human-hours worth of work, even though the wall-clock time they worked was only 8 hours.
Parallelized batch compute
Parallelized Batch compute represents queries or jobs that run in a "batch" capacity, meaning they are triggered to run in the background on a certain scheduled cadence or ad-hoc basis. Batch compute jobs do not consume any compute when they are not being run. Foundry will automatically allocate computational resources to these jobs as soon as they are triggered. Compute usage is metered as soon as the resources are provisioned and until they are relinquished from the job.
To provide insight into how compute resources are used across the platform, vCPU and memory usage is measured for individual jobs and reported on a dataset and object level.
Currently, the following batch compute jobs are monitored:
- All Transforms jobs (Java, Python, SQL, Mesa, GPU)
- Pipeline Builder
- Builds of datasets saved from Contour (not Contour Previews, Analyses, or Reports)
- Code Workbooks
- Syncs to Ontology and indexed storage (e.g. object storage and timeseries syncs)
- Object Storage V1 (Phonograph) writeback jobs
- Data Health checks
Parallelized interactive compute
Interactive compute represents queries that are evaluated in real-time, usually as part of an interactive user session. To provide fast responses, interactive compute systems maintain always-on idle compute, which means interactive queries are more expensive than batch evaluation.
Interactive usage is reported for each query - a query consumes its fair share of the backend application where it was scheduled. That usage is then rolled up on the Project level, much like batch compute.
Currently, queries from the following applications are included in interactive compute usage:
Parallelized continuous compute
Continuous compute is used by always-on processing jobs that are continuously available to receive messages and process them using arbitrary logic.
Continuous compute is measured for the length of time that the job is ready to receive messages and perform work.
Currently, usage from the following applications are included in continuous compute:
:::callout{theme="neutral"} The ability to create a continuous compute job is not available on all Foundry environments. Contact your Palantir representative for more information if your use case requires it. :::
Units of measurement in parallelized compute
For parallel processing compute, we generate compute-seconds by measuring two metrics: core-seconds and memory-to-core ratio.
Parallelized core-seconds
Core-seconds reflect the number of vCPU cores used for the duration of job. For example, 2 cores used for 3 seconds results in 6 core-seconds. The duration of a job is the time between submitting the job and the job reporting completion. This includes spin-up time and job cleanup time.
To determine how many cores a given job used, the properties of the job are inspected. Specifically, the number of executors, the number of vCPU cores for the executors, and the driver are taken into consideration.
A common parallelized compute engine in the platform is Spark. Some users may only interact with Spark Configuration Service profiles, which provide pre-determined Spark configurations in “sizes”. Usually, these properties are specified in the job’s Spark profile or are set to system defaults.
For example:
spark.driver.cores = 3
spark.executor.cores = 2
In this example, the total core-seconds can be calculated in the following way:
core_seconds = (num_driver_cores + num_executor_cores * num_executors) * job_duration_in_seconds
:::callout{theme="warning"} Usage is based on allocated vCPU cores, not on the utilization of those cores. We recommend requesting only the necessary resources for your jobs to avoid over-allocation. :::
Memory-to-core ratio
Given that live computation hosts have a fixed memory-to-core ratio, we must consider how many GiB of memory are used per core. Let's say we have a host with four cores and 32GiB of memory. On this host, we could schedule four jobs, each one of them requesting one core and 8GiB of memory. However, if one of these jobs request more memory, 16GiB, other jobs cannot take advantage of the additional cores as there is insufficient memory. This means that one of the remaining jobs will require additional capacity. As a result, the ratio of memory-to-cores is a key part of the compute-second computation.
In Foundry, the default memory-to-core ratio is 7.5 GiB per core .
Parallelized core-seconds to compute-seconds
Foundry compute-seconds reflect both the number of vCPU cores and the amount of memory that was reserved for a job. Compute-seconds combine core-seconds with the amount of memory reserved.
In summary, we calculate compute-seconds by taking the maximum of two factors:
- Cores used per task, and the
- Memory-to-core ratio of the executor of the task.
This can be expressed with the following expression: max(num_vpcu, gib_ram / 7.5)
Consider the example below with the following characteristics:
- Two Executors, each with one core and 12GiB RAM
- Total wall-clock computation time is 5 seconds
vcpu_per_executor = 1
ram_per_executor = 12
num_executors = 2
num_seconds = 5

default_memory_to_core_ratio = 7.5
job_memory_multiplier = 12 / 7.5 = 1.6

job_core_seconds = num_vcpu * num_excutors * num_seconds
job_core_seconds = 1 * 2 * 5 = 10

job_compute_seconds = max(num_vcpu, job_memory_multiplier) * num_executors * num_seconds
job_compute_seconds = max(1vcpu, 1.6mem-to-core) * 2executors * 5sec
job_compute_seconds = 16 compute-seconds
We can see that while the job only used 10 core-seconds, it used 16 compute-seconds total due to the outsized memory request.
Query compute-seconds
In Foundry, there are various indexed stores that can be queried in an on-demand manner. Each of these indexed stores uses compute-seconds when executing their queries. For documentation on how queries use compute-seconds, refer to the following documentation.
Ontology volume
Foundry's Ontology and indexed data formats provide tools for fast, organization-centric queries and actions. These backing systems store the data in formats that are significantly more flexible for ad-hoc operational and analytical use cases. Ontology volume is measured in gigabyte-months.
Ontology Volume usage is tracked in the following systems:
- Ontology objects (v1 & v2)
- Postgate (Postgres interface, not available in all Foundry configurations)
- Lime (legacy document store without Ontology mappings)
:::callout{theme="neutral"} The size of the synced dataset may be different than the size in Foundry. This is because each system uses different layouts or compression to store and serve data. :::
Foundry storage
Foundry storage measures the general purpose data stored in the non-Ontology transformation layers in Foundry. Disk usage is measured in gigabyte-months.
Each dataset’s storage usage is calculated individually. Dataset branches and previous transactions (and views) impact how much disk space a single dataset consumes. When files are removed from a view with a DELETE transaction, the files are not removed from the underlying storage and thus continue to accrue storage costs. The total disk usage is calculated in two steps:
- Looking at all the transactions that were ever committed or aborted on a dataset and summing up the size of the underlying files that were added.
- Subtracting all the transactions that were delete using Retention to get the live disk space used.
The only way to reduce size is to use Retention to clean up unnecessary transactions. Commiting a DELETE transaction or updating branches does not reduce storage used.
Ontology volume usage attribution
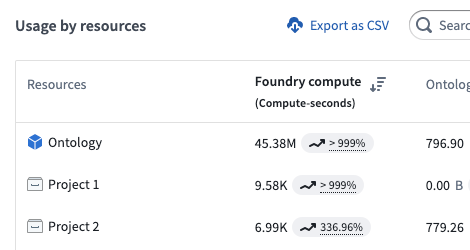
Ontology volume usage is primarily attributed to the project of each object's input datasource. Foundry resources and objects appear side-by-side when viewing the granular usage details for any project as shown below.
Note: When usage is attributed to a Workshop application with embedded modules, it will account for any usage that occurs in its embedded modules.
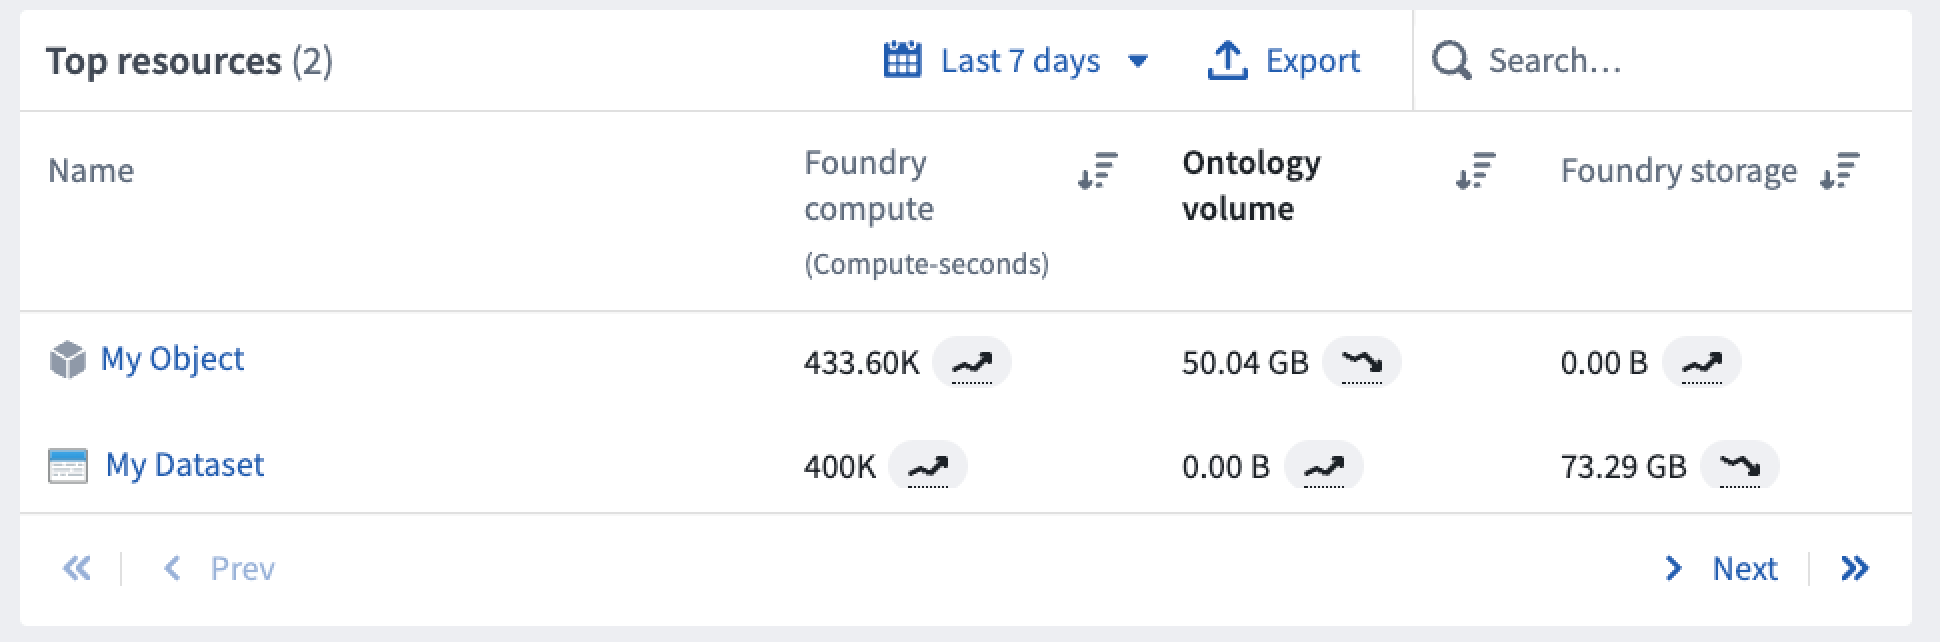
Some objects are unattributable to a single project; for example, an object may have multiple input datasources that span multiple projects. In these cases, usage is attributed to the Ontology itself as below.
In general, objects accrue the following types of usage:
- Foundry Compute captures compute used to index datasets to object types; in other words, the cost of syncing the Ontology.
- Ontology Volume captures the size of the indexes of all object types.
- Foundry Storage is empty for objects.
Job attribution
All usage in the Resource Management application - including timestamps, date ranges, and usage aggregations - is recorded and displayed strictly in UTC.
Jobs are attributed based on their finish time. When a job completes, its usage is assigned to the UTC date on which it finished. For jobs that span multiple days, all usage is attributed to the date the job ended, not the date it started. This applies to all compute work, including batch, interactive, and continuous compute.
Usage units
Compute-second
All computational work done by all Foundry products is expressed as compute-seconds. In the Foundry platform, a compute-second is not a measurement of time, but rather a unit of work that the platform executes. The compute-second is the atomic unit of work in the platform, meaning it is the minimum granularity at which compute is measured in Foundry. See the table below for details on how each Foundry product type uses compute-seconds.
Gigabyte-month
All storage usage by all Foundry products is expressed as gigabyte-months, which is a measure of allocated storage over time. A 1GB data file consumes 1 GB-month of usage per month.
The storage volume is calculated hourly, and the gigabyte-months value is calculated from the total hourly measurements in that monthly period. For example, for a month with 30 days:
Days 0-3      - 0GB volume
Day 4, 06:00  - 3GB volume (3GB added)
Days 5-10     - 3GB volume (no change from day 3)
Day 11, 00:00 - 6GB volume (3GB added)
Days 11-20    - 6GB volume (no change)
Day 21, 00:00 - 3GB volume (3GB deleted)
Days 21-30    - 3GB volume (no change)

Total:
(0GB * 4 days + 3GB * (18hrs/24) days + 3GB * 6 days + 6GB * 10 days + 3GB * 10 days) / 30 days
   = 3.675 gigabyte-months of usage
Since the number of days in a month varies, the gigabyte-months generated per day by the same volume of storage will change per month. For example:
90GB stored for 1 day in a month with 30 days will consume:
(90GB * 1 day) / 30 days = 3 gigabyte-months

90GB stored for 1 day in a month with 31 days will consume:
(90GB * 1 day) / 31 days = 2.90 gigabyte-months
This means that, when viewing storage usage for a dataset of unchanging size, the gigabyte-months consumed by day or week will have some fluctuation; the gigabyte-months consumed for the whole month will not fluctuate.
List of Foundry applications and associated usage
Data transformation
| Foundry application | Foundry compute | Foundry Ontology volume | Foundry storage |
|---|---|---|---|
| Code Repositories (Python, Java, SQL, GPU, Mesa) | Yes | No | Yes |
| Streaming repositories | Yes | No | No |
| Pipeline Builder | Yes | No | Yes |
| Preparation | Yes | No | Yes |
| Data Connection (Agent-based) | No | No | Yes |
| Data Connection (cloud ingest) | Yes | No | Yes |
| Data Health | Yes | No | No |
| Dataset projections | Yes | No | No |
| Object indexing (Phonograph2) | Yes | Yes | No |
| Time series indexing | Yes | No | No |
| Recipes | Yes | No | No |
Analytics
| Foundry application | Foundry compute | Foundry Ontology volume | Foundry storage |
|---|---|---|---|
| Code Workbook: Spark | Yes | No | Yes |
| Code Workbook: GPU | Yes | No | Yes |
| Contour analysis | Yes | No | No |
| Contour builds and dashboards | Yes | No | Yes |
| Reports | Yes (from other applications) | No | No |
| Restricted Views | Yes | No | No |
| Notepad | Yes (from other applications) | No | No |
| Fusion | No | Yes | Yes (writeback) |
Model and AI integration
| Foundry application | Foundry compute | Foundry Ontology volume | Foundry storage |
|---|---|---|---|
| Foundry ML batch | Yes | No | Yes |
| Foundry ML live | Yes | No | No |
Ontology and application building
| Foundry application | Foundry compute | Foundry Ontology volume | Foundry storage |
|---|---|---|---|
| Ontology objects | Yes | Yes | Yes (export) |
| Ontology relationship tables | Yes | Yes | Yes (export) |
| Ontology Actions | Yes | Yes (writeback) | No |
| Direct Object Storage V1 indices | Yes | Yes | Yes (export) |
| Postgres indices | Yes | Yes | No |
| Direct Lime indices | Yes | Yes | No |
| Foundry Rules | Yes | Yes | Yes |
Notes:
Yes (writeback) refers to the process of storing user edits or user created objects to the object set in Foundry.
Yes (export) refers to the process of storing user edits to the designated writeback dataset in Foundry.
Yes (from other applications) refers to the usage generated by other embedded Foundry applications, such as a Contour board embedded in a Notepad document.
中文翻译
使用类型
资源透明度报告可在资源管理应用中查看,用户可在此查看项目和本体(Ontology)所消耗的计算和存储资源的详细分解。
Foundry 计算
Foundry 是一个在数据之上运行计算工作的平台。这些工作通过 Foundry 计算秒 来衡量。计算秒代表平台中的计算工作单位,批处理(长时间运行)和交互式(临时)应用都会使用。这些计算秒可能由多种因素驱动,包括并行化计算执行器的数量、计算执行器的大小、所处理数据的大小以及计算作业的复杂度。
Foundry 中的许多计算框架以"并行"方式运行,这意味着多个执行器同时处理同一个作业。并行化显著加快了大多数作业的执行速度,但单位时间内会消耗更多的计算秒。
挂钟时间
一个需要定义的重要术语是挂钟时间(wall-clock time)。挂钟时间,也称为经过的真实时间,是指从进程开始到测量点所经过的实际时间,就像墙上的时钟或秒表测量的那样。换句话说,挂钟时间是任务开始时间与任务完成时间之间的差值(以秒为单位)。需要注意的是,每个挂钟秒内可能使用多个 Foundry 计算秒,并且不同类型的作业根据其配置以不同的速率消耗计算秒。
关于挂钟时间与 Foundry 计算秒的一个有用类比是"人时"的概念。两个人每人工作 8 小时,总共产生 16 人时的工作量,尽管他们工作的挂钟时间只有 8 小时。
并行化批处理计算
并行化批处理计算(Parallelized Batch compute)代表以"批处理"方式运行的查询或作业,这意味着它们按特定计划节奏或临时方式在后台触发运行。批处理计算作业在不运行时不会消耗任何计算资源。一旦作业被触发,Foundry 会自动为其分配计算资源。计算使用量从资源配置完成时开始计量,直到资源从作业中释放为止。
为了深入了解计算资源在平台中的使用情况,系统会测量单个作业的 vCPU 和内存使用量,并在数据集和对象级别进行报告。
目前,以下批处理计算作业受到监控:
- 所有转换作业(Java、Python、SQL、Mesa、GPU)
- Pipeline Builder
- 从 Contour 保存的数据集构建(不包括 Contour 预览、分析或报告)
- 代码工作簿
- 同步到本体和索引存储(例如对象存储和时序同步)
- 对象存储 V1 (Phonograph) 写回作业
- 数据健康检查
并行化交互式计算
交互式计算(Interactive compute)代表实时评估的查询,通常是交互式用户会话的一部分。为了提供快速响应,交互式计算系统保持始终在线的空闲计算资源,这意味着交互式查询比批处理评估更昂贵。
交互式使用量按每个查询报告——查询消耗其在所调度后端应用中的公平份额。然后,这些使用量在项目级别汇总,类似于批处理计算。
目前,以下应用的查询包含在交互式计算使用量中:
并行化持续计算
持续计算(Continuous compute)用于始终在线的处理作业,这些作业持续可用以接收消息并使用任意逻辑进行处理。
持续计算按作业准备好接收消息并执行工作的时长进行测量。
目前,以下应用的使用量包含在持续计算中:
:::callout{theme="neutral"} 并非所有 Foundry 环境都支持创建持续计算作业。如果您的用例需要此功能,请联系您的 Palantir 代表以获取更多信息。 :::
并行化计算的计量单位
对于并行处理计算,我们通过测量两个指标来生成计算秒:核心秒和内存与核心比率。
并行化核心秒
核心秒(Core-seconds)反映作业持续时间内使用的 vCPU 核心数量。例如,2 个核心使用 3 秒产生 6 个核心秒。作业的持续时间是从提交作业到作业报告完成之间的时间,包括启动时间和作业清理时间。
要确定给定作业使用了多少核心,需要检查作业的属性。具体来说,会考虑执行器的数量、执行器的 vCPU 核心数量以及驱动程序。
平台中常见的并行化计算引擎是 Spark。一些用户可能只与 Spark 配置服务配置文件交互,这些配置文件以"大小"提供预定义的 Spark 配置。通常,这些属性在作业的 Spark 配置文件中指定,或设置为系统默认值。
例如:
spark.driver.cores = 3
spark.executor.cores = 2
在此示例中,总核心秒数可按以下方式计算:
core_seconds = (num_driver_cores + num_executor_cores * num_executors) * job_duration_in_seconds
:::callout{theme="warning"} 使用量基于已分配的 vCPU 核心,而非这些核心的利用率。我们建议仅为您的作业请求必要的资源,以避免过度分配。 :::
内存与核心比率
鉴于实时计算主机具有固定的内存与核心比率,我们必须考虑每个核心使用了多少 GiB 内存。假设我们有一个具有四个核心和 32GiB 内存的主机。在此主机上,我们可以调度四个作业,每个作业请求一个核心和 8GiB 内存。但是,如果其中一个作业请求更多内存(16GiB),则其他作业无法利用额外的核心,因为内存不足。这意味着剩余作业之一将需要额外的容量。因此,内存与核心的比率是计算秒计算的关键部分。
在 Foundry 中,默认的内存与核心比率为 每个核心 7.5 GiB。
从并行化核心秒到计算秒
Foundry 计算秒同时反映为作业预留的 vCPU 核心数量和内存量。计算秒将核心秒与预留的内存量结合起来。
总之,我们通过取以下两个因素的最大值来计算计算秒:
- 每个任务使用的核心数,以及
- 任务执行器的内存与核心比率。
这可以用以下表达式表示:max(num_vpcu, gib_ram / 7.5)
考虑以下具有以下特征的示例:
- 两个执行器,每个具有一个核心和 12GiB RAM
- 总挂钟计算时间为 5 秒
vcpu_per_executor = 1
ram_per_executor = 12
num_executors = 2
num_seconds = 5

default_memory_to_core_ratio = 7.5
job_memory_multiplier = 12 / 7.5 = 1.6

job_core_seconds = num_vcpu * num_excutors * num_seconds
job_core_seconds = 1 * 2 * 5 = 10

job_compute_seconds = max(num_vcpu, job_memory_multiplier) * num_executors * num_seconds
job_compute_seconds = max(1vcpu, 1.6mem-to-core) * 2executors * 5sec
job_compute_seconds = 16 compute-seconds
我们可以看到,虽然该作业仅使用了 10 个核心秒,但由于过大的内存请求,它总共使用了 16 个计算秒。
查询计算秒
在 Foundry 中,有多种索引存储可以按需查询。每个索引存储在执行查询时都会使用计算秒。有关查询如何使用计算秒的文档,请参考以下文档。
本体容量
Foundry 的本体和索引数据格式提供了用于快速、以组织为中心的查询和操作的工具。这些后端系统以对临时操作和分析用例更加灵活的方式存储数据。本体容量以吉字节月为单位进行测量。
本体容量使用量在以下系统中进行跟踪:
- 本体对象(v1 和 v2)
- Postgate(Postgres 接口,并非所有 Foundry 配置都可用)
- Lime(无本体映射的旧版文档存储)
:::callout{theme="neutral"} 同步数据集的大小可能与 Foundry 中的大小不同。这是因为每个系统使用不同的布局或压缩来存储和提供数据。 :::
Foundry 存储
Foundry 存储测量存储在 Foundry 中非本体转换层的通用数据。磁盘使用量以吉字节月为单位进行测量。
每个数据集的存储使用量单独计算。数据集分支和先前事务(以及视图)会影响单个数据集消耗的磁盘空间量。当使用 DELETE 事务从视图中删除文件时,这些文件不会从底层存储中删除,因此会继续产生存储成本。总磁盘使用量分两步计算:
- 查看数据集上曾经提交或中止的所有事务,并汇总所添加底层文件的大小。
- 减去使用保留(Retention)删除的所有事务,以获得正在使用的实时磁盘空间。
减小大小的唯一方法是使用保留(Retention)来清理不必要的事务。提交 DELETE 事务或更新分支不会减少使用的存储空间。
本体容量使用归属
本体容量使用量主要归属于每个对象输入数据源的项目。查看任何项目的详细使用详情时,Foundry 资源和对象会并排显示,如下所示。
注意: 当使用量归属于包含嵌入模块的 Workshop 应用时,它将计入其嵌入模块中发生的任何使用量。
某些对象无法归属于单个项目;例如,一个对象可能有多个跨多个项目的输入数据源。在这些情况下,使用量归属于本体本身,如下所示。
通常,对象会产生以下类型的使用量:
- Foundry 计算捕获用于将数据集索引到对象类型的计算;换句话说,即同步本体的成本。
- 本体容量捕获所有对象类型的索引大小。
- Foundry 存储对于对象为空。
作业归属
资源管理应用中的所有使用量——包括时间戳、日期范围和使用量聚合——均严格以 UTC 记录和显示。
作业根据其完成时间进行归属。当作业完成时,其使用量被分配到其完成的 UTC 日期。对于跨越数天的作业,所有使用量都归属于作业结束的日期,而非开始的日期。这适用于所有计算工作,包括批处理、交互式和持续计算。
使用单位
计算秒
所有 Foundry 产品执行的所有计算工作都以 计算秒(compute-seconds)表示。在 Foundry 平台中,计算秒不是时间测量单位,而是平台执行的工作单位。计算秒是平台中的原子工作单位,意味着它是 Foundry 中计算测量的最小粒度。有关每种 Foundry 产品类型如何使用计算秒的详细信息,请参见下表。
吉字节月
所有 Foundry 产品的存储使用量都以 吉字节月(gigabyte-months)表示,这是随时间推移的已分配存储量的度量。一个 1GB 的数据文件每月消耗 1 GB-month 的使用量。
存储容量每小时计算一次,吉字节月值根据该月期间的总小时测量值计算。例如,对于一个有 30 天的月份:
第 0-3 天      - 0GB 容量
第 4 天 06:00  - 3GB 容量(添加 3GB)
第 5-10 天     - 3GB 容量(与第 3 天相比无变化)
第 11 天 00:00 - 6GB 容量(添加 3GB)
第 11-20 天    - 6GB 容量(无变化)
第 21 天 00:00 - 3GB 容量(删除 3GB)
第 21-30 天    - 3GB 容量(无变化)

总计:
(0GB * 4 天 + 3GB * (18小时/24) 天 + 3GB * 6 天 + 6GB * 10 天 + 3GB * 10 天) / 30 天
   = 3.675 吉字节月的使用量
由于每月的天数不同,相同存储容量每天产生的 吉字节月 会逐月变化。例如:
90GB 存储 1 天,在一个有 30 天的月份中将消耗:
(90GB * 1 天) / 30 天 = 3 吉字节月

90GB 存储 1 天,在一个有 31 天的月份中将消耗:
(90GB * 1 天) / 31 天 = 2.90 吉字节月
这意味着,在查看大小不变的数据集的存储使用量时,按天或按周消耗的 吉字节月 会有一些波动;但整月消耗的 吉字节月 不会波动。
Foundry 应用及相关使用量列表
数据转换
| Foundry 应用 | Foundry 计算 | Foundry 本体容量 | Foundry 存储 |
|---|---|---|---|
| 代码仓库(Python、Java、SQL、GPU、Mesa) | 是 | 否 | 是 |
| 流处理仓库 | 是 | 否 | 否 |
| Pipeline Builder | 是 | 否 | 是 |
| Preparation | 是 | 否 | 是 |
| 数据连接(基于代理) | 否 | 否 | 是 |
| 数据连接(云摄取) | 是 | 否 | 是 |
| 数据健康 | 是 | 否 | 否 |
| 数据集投影 | 是 | 否 | 否 |
| 对象索引(Phonograph2) | 是 | 是 | 否 |
| 时序索引 | 是 | 否 | 否 |
| 配方 | 是 | 否 | 否 |
分析
| Foundry 应用 | Foundry 计算 | Foundry 本体容量 | Foundry 存储 |
|---|---|---|---|
| 代码工作簿:Spark | 是 | 否 | 是 |
| 代码工作簿:GPU | 是 | 否 | 是 |
| Contour 分析 | 是 | 否 | 否 |
| Contour 构建和仪表板 | 是 | 否 | 是 |
| 报告 | 是(来自其他应用) | 否 | 否 |
| 受限视图 | 是 | 否 | 否 |
| Notepad | 是(来自其他应用) | 否 | 否 |
| Fusion | 否 | 是 | 是(写回) |
模型与 AI 集成
| Foundry 应用 | Foundry 计算 | Foundry 本体容量 | Foundry 存储 |
|---|---|---|---|
| Foundry ML 批处理 | 是 | 否 | 是 |
| Foundry ML 实时 | 是 | 否 | 否 |
本体与应用构建
| Foundry 应用 | Foundry 计算 | Foundry 本体容量 | Foundry 存储 |
|---|---|---|---|
| 本体对象 | 是 | 是 | 是(导出) |
| 本体关系表 | 是 | 是 | 是(导出) |
| 本体操作 | 是 | 是(写回) | 否 |
| 直接对象存储 V1 索引 | 是 | 是 | 是(导出) |
| Postgres 索引 | 是 | 是 | 否 |
| 直接 Lime 索引 | 是 | 是 | 否 |
| Foundry 规则 | 是 | 是 | 是 |
注释:
是(写回) 指将用户编辑或用户创建的对象存储到 Foundry 中对象集的过程。
是(导出) 指将用户编辑存储到 Foundry 中指定写回数据集的过程。
是(来自其他应用) 指由其他嵌入的 Foundry 应用(例如嵌入在 Notepad 文档中的 Contour 面板)产生的使用量。