Alert debug page(警报调试页面)
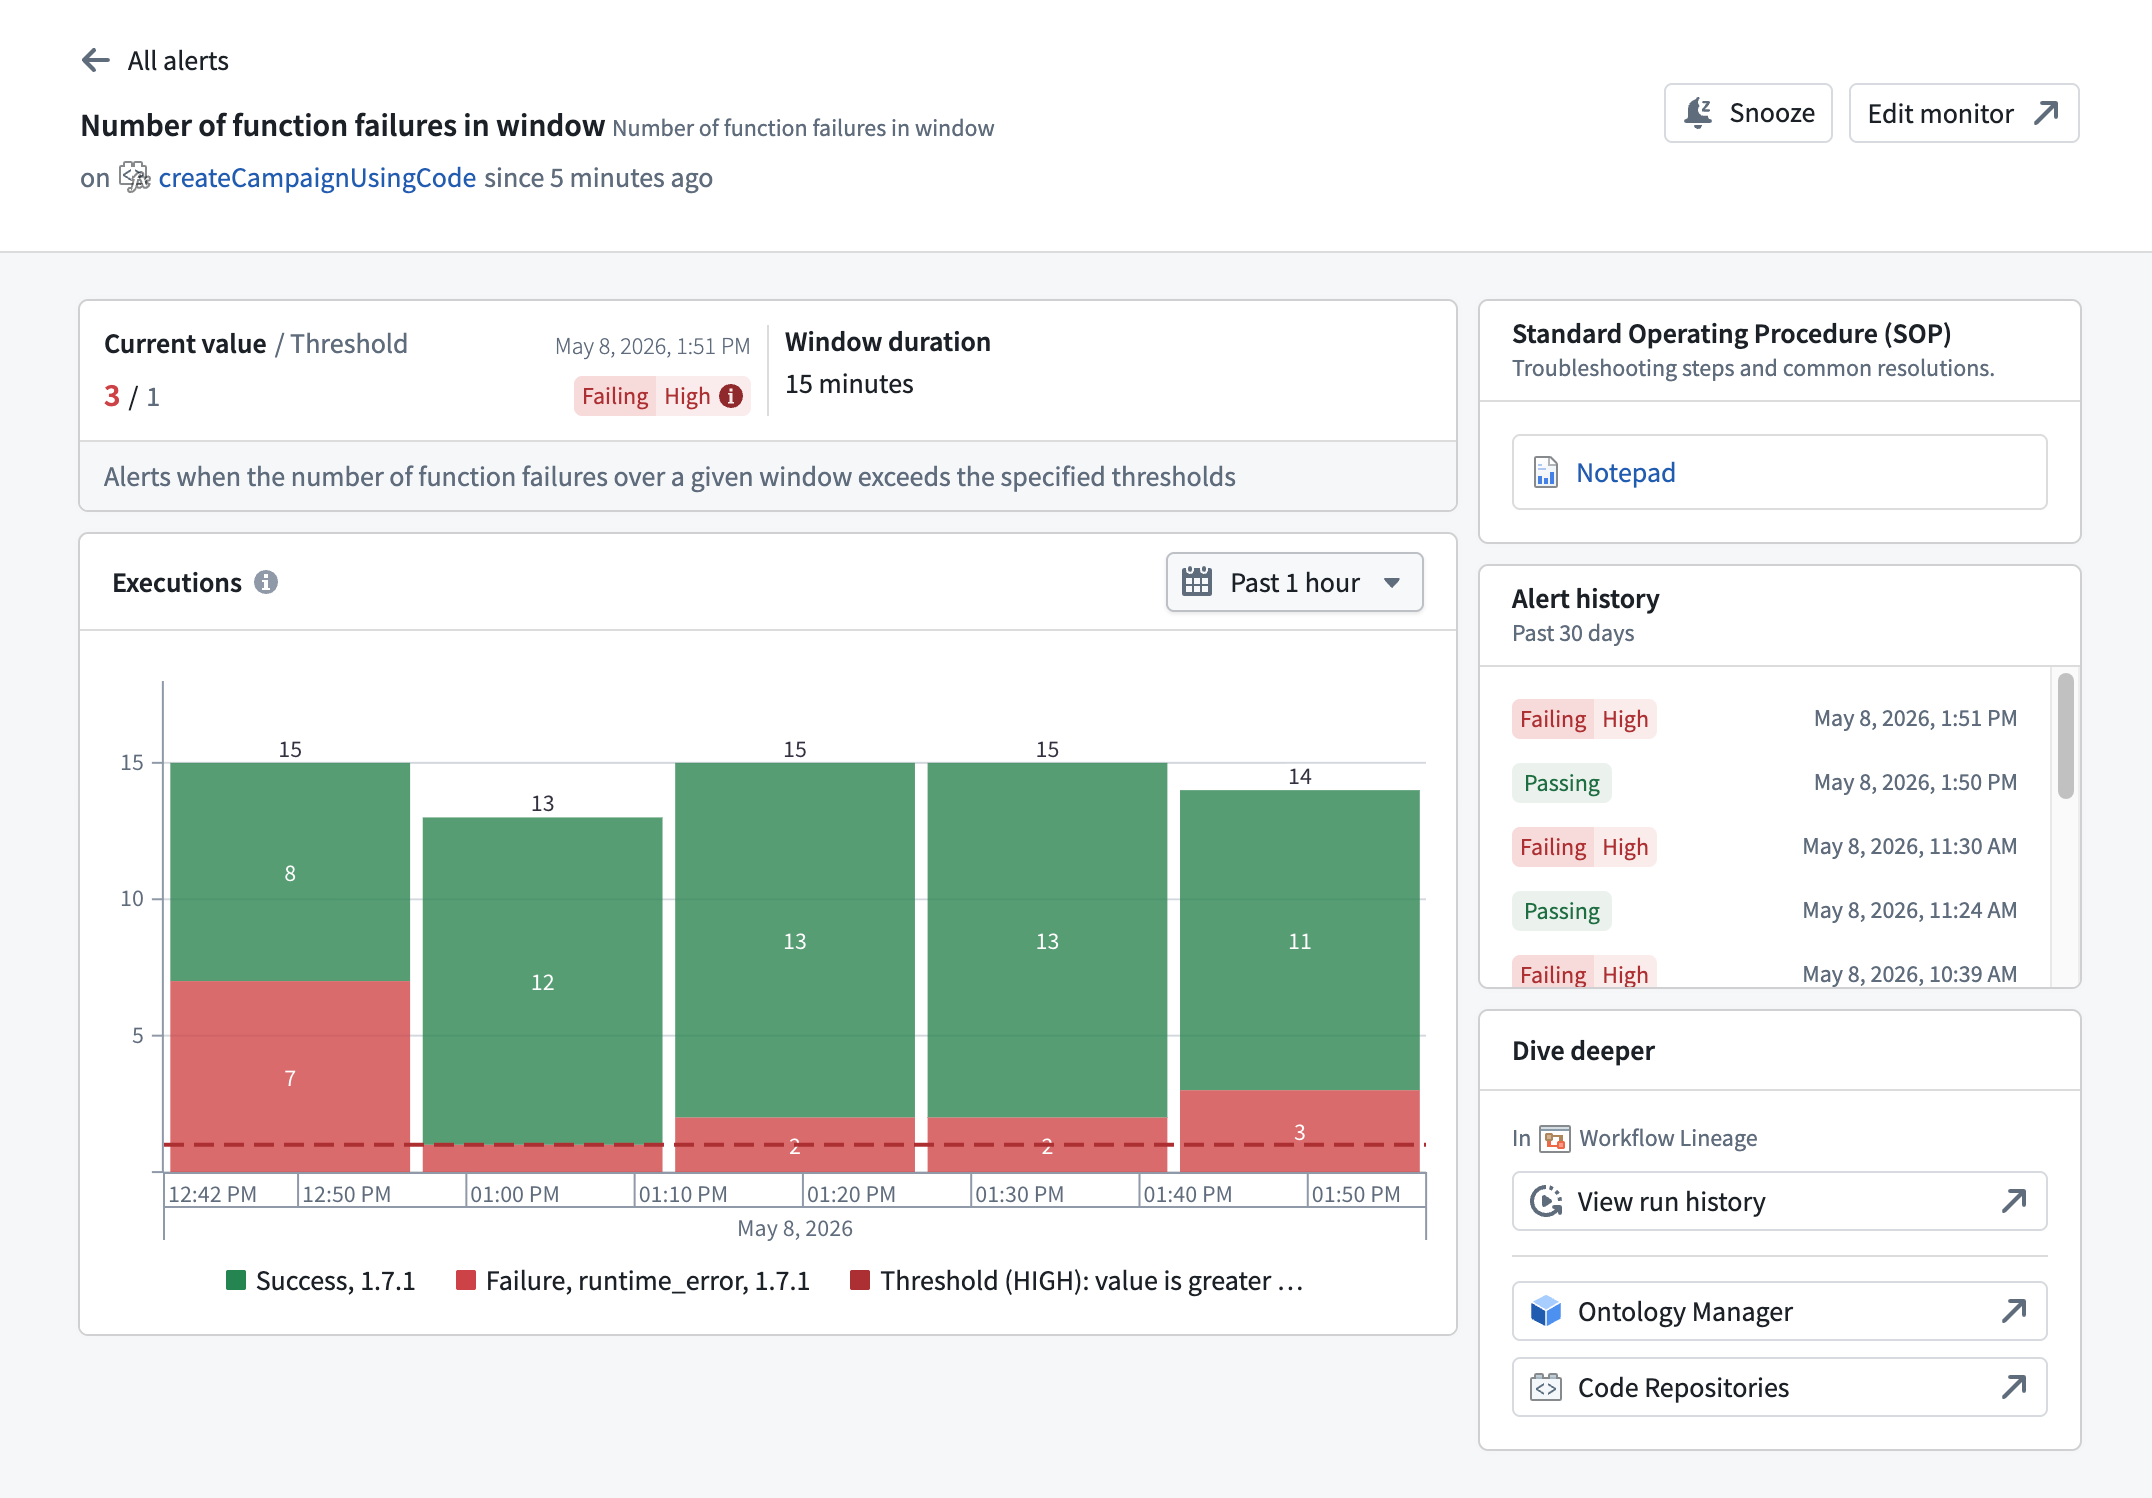
The alert debug page provides a detailed diagnostic view for a monitor rule firing on a specific resource. To access the alert debug page, navigate to the Troubleshoot alerts tab in the Data Health application and select View details on an alert.
:::callout{theme="neutral"} The alert debug page currently supports function and action type resources. Support for additional resource types is planned. :::
Header
The page header identifies the monitor rule and provides quick actions:
- Monitor name: Shown alongside the template name the rule was created from.
- Status line: In the form
on <resource> since <time>, indicating the resource that the rule fired on and how long the rule has been in its current state. - Snooze: Temporarily silences notifications for this monitor rule. When a snooze is active, an indicator appears in the header.
- Edit monitor: Opens the monitor rule in the rule configuration view for editing.
Use the back arrow to return to the Troubleshoot alerts tab.
Metrics
The metrics section displays the current state of the monitored metric:
- Current value / Threshold: The latest value of the monitored metric alongside the threshold that triggers a firing alert. The timestamp of the most recent evaluation appears next to the values.
- Window duration: For monitor rules with a windowed condition (for example, rules that count failures over a fixed time interval), the evaluation window over which the condition is computed.
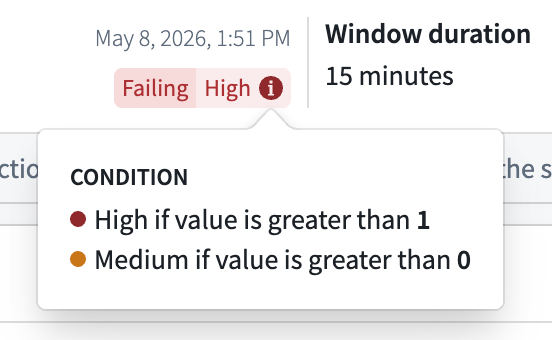
- Status badge: A badge showing the current state of the rule. When the condition is no longer met, the badge displays
Passing. When the rule is firing, the badge displaysFailingpaired with the configured severity level (Low,Medium, orHigh).
The monitor description appears below the metric values.
Hover over the condition tag to view a breakdown of all severity conditions configured on the rule.
Standard operating procedure
When a monitor rule has a Standard Operating Procedure (SOP) attached, the SOP card displays a link to the associated Notepad resource. The card provides quick access to troubleshooting steps and common resolutions documented for the rule.
A monitor rule can surface up to two SOPs, each displayed as a link to its associated Notepad resource:
- Monitor rule SOP: The SOP attached directly to the monitor rule. You can add, replace, or remove it from the Manage monitors tab in the Data Health application.
- Default template SOP: The SOP defined by the monitor's template, if one is set. This is provided by the service and is read-only.
Chart
The chart section displays the monitored metric values over time. The chart includes a description of the metric being tracked. The description varies by resource type (function or action type).
Use the date range picker above the chart to adjust the time window, or interact directly with the chart.
Alert history
The alert history section displays a timeline of monitor status transitions for this rule over the past 30 days. Each entry shows the status badge and the timestamp of the transition. Scroll down to load additional history.
Dive deeper
The Dive deeper section provides links for further investigation of the monitored resource:
- Workflow Lineage: Opens the resource run history in Workflow Lineage. Workflow Lineage applies pre-filters based on the firing condition's metric to surface the most relevant executions. For details on the filters applied for each metric type, see Navigate to resource lineage from an alert.
- Ontology Manager: Opens the target resource overview in Ontology Manager.
- Code Repositories: For function alerts, opens the source repository in Code Repositories. This link appears only when the function's source repository is known.
Unsupported resource types
The alert debug page only provides detailed diagnostics for function and action type resources. If you open the page for a monitor rule on another resource type, it displays an empty state explaining that detailed diagnostics are not yet available. The Troubleshoot alerts tab continues to provide high-level alert information for these rules.
中文翻译
警报调试页面
警报调试页面(alert debug page)提供了针对特定资源上触发的监控规则(monitor rule)的详细诊断视图。要访问警报调试页面,请在 Data Health 应用程序中导航至 Troubleshoot alerts 选项卡,然后选择某个警报上的 View details。
:::callout{theme="neutral"} 警报调试页面目前支持函数(function)和操作类型(action type)资源。计划在未来支持更多资源类型。 :::
页眉
页面页眉标识了监控规则,并提供了快速操作:
- 监控名称: 与创建规则所用的模板名称一同显示。
- 状态行: 格式为
on <resource> since <time>,指示规则触发的资源以及规则保持当前状态的持续时间。 - 静音: 临时静音此监控规则的通知。静音激活时,页眉中会显示一个指示器。
- 编辑监控: 在规则配置视图中打开监控规则以进行编辑。
使用返回箭头可返回 Troubleshoot alerts 选项卡。
指标
指标部分显示受监控指标的当前状态:
- 当前值 / 阈值: 受监控指标的最新值,以及触发警报的阈值。最近一次评估的时间戳显示在数值旁边。
- 窗口时长: 对于具有窗口条件(windowed condition)的监控规则(例如,在固定时间间隔内统计失败次数的规则),显示计算条件所用的评估窗口。
- 状态徽章: 显示规则当前状态的徽章。当条件不再满足时,徽章显示
Passing。当规则触发时,徽章显示Failing,并附带配置的严重级别(Low、Medium或High)。
监控描述显示在指标值下方。
将鼠标悬停在条件标签上,可查看规则上配置的所有严重条件的细分。
标准操作流程
当监控规则附加了标准操作流程(Standard Operating Procedure,SOP)时,SOP 卡片会显示指向关联 Notepad 资源的链接。该卡片可快速访问为该规则记录的故障排除步骤和常见解决方案。
一条监控规则最多可显示两个 SOP,每个 SOP 均以指向其关联 Notepad 资源的链接形式呈现:
- 监控规则 SOP: 直接附加到监控规则的 SOP。您可以在 Data Health 应用程序的 Manage monitors 选项卡中添加、替换或删除它。
- 默认模板 SOP: 由监控模板定义的 SOP(如果已设置)。此 SOP 由服务提供,且为只读。
图表
图表部分显示受监控指标随时间变化的数值。图表包含所跟踪指标的描述。描述因资源类型(函数或操作类型)而异。
使用图表上方的日期范围选择器调整时间窗口,或直接与图表交互。
警报历史记录
警报历史记录部分显示过去 30 天内此规则的状态转换时间线。每条记录显示状态徽章和转换的时间戳。向下滚动可加载更多历史记录。
深入探究
深入探究部分提供了用于进一步调查受监控资源的链接:
- Workflow Lineage: 在 Workflow Lineage 中打开资源运行历史记录。Workflow Lineage 会根据触发条件的指标应用预过滤器,以显示最相关的执行记录。有关每种指标类型所应用过滤器的详细信息,请参阅从警报导航到资源血缘。
- Ontology Manager: 在 Ontology Manager 中打开目标资源概览。
- Code Repositories: 对于函数警报,在 Code Repositories 中打开源代码仓库。仅当函数的源代码仓库已知时,此链接才会显示。
不支持的资源类型
警报调试页面仅提供函数和操作类型资源的详细诊断信息。如果您为其他资源类型的监控规则打开此页面,它将显示一个空状态,说明详细诊断功能尚不可用。Troubleshoot alerts 选项卡将继续为这些规则提供高级警报信息。