Observability(可观测性(Observability))
The Palantir platform provides built-in tools to monitor the health of your resources, debug issues in development and production, trace execution across services, and analyze telemetry at scale.
Monitor: You can use the Data Health tool to monitor the platform. With Data Health, you can set up rules and define thresholds for failures, latency and more; configure monitors per resource or at scale across projects; receive alerts through PagerDuty, Slack, webhooks, or Foundry notifications; and view execution counts and P95 latency metrics for the last 30 days.
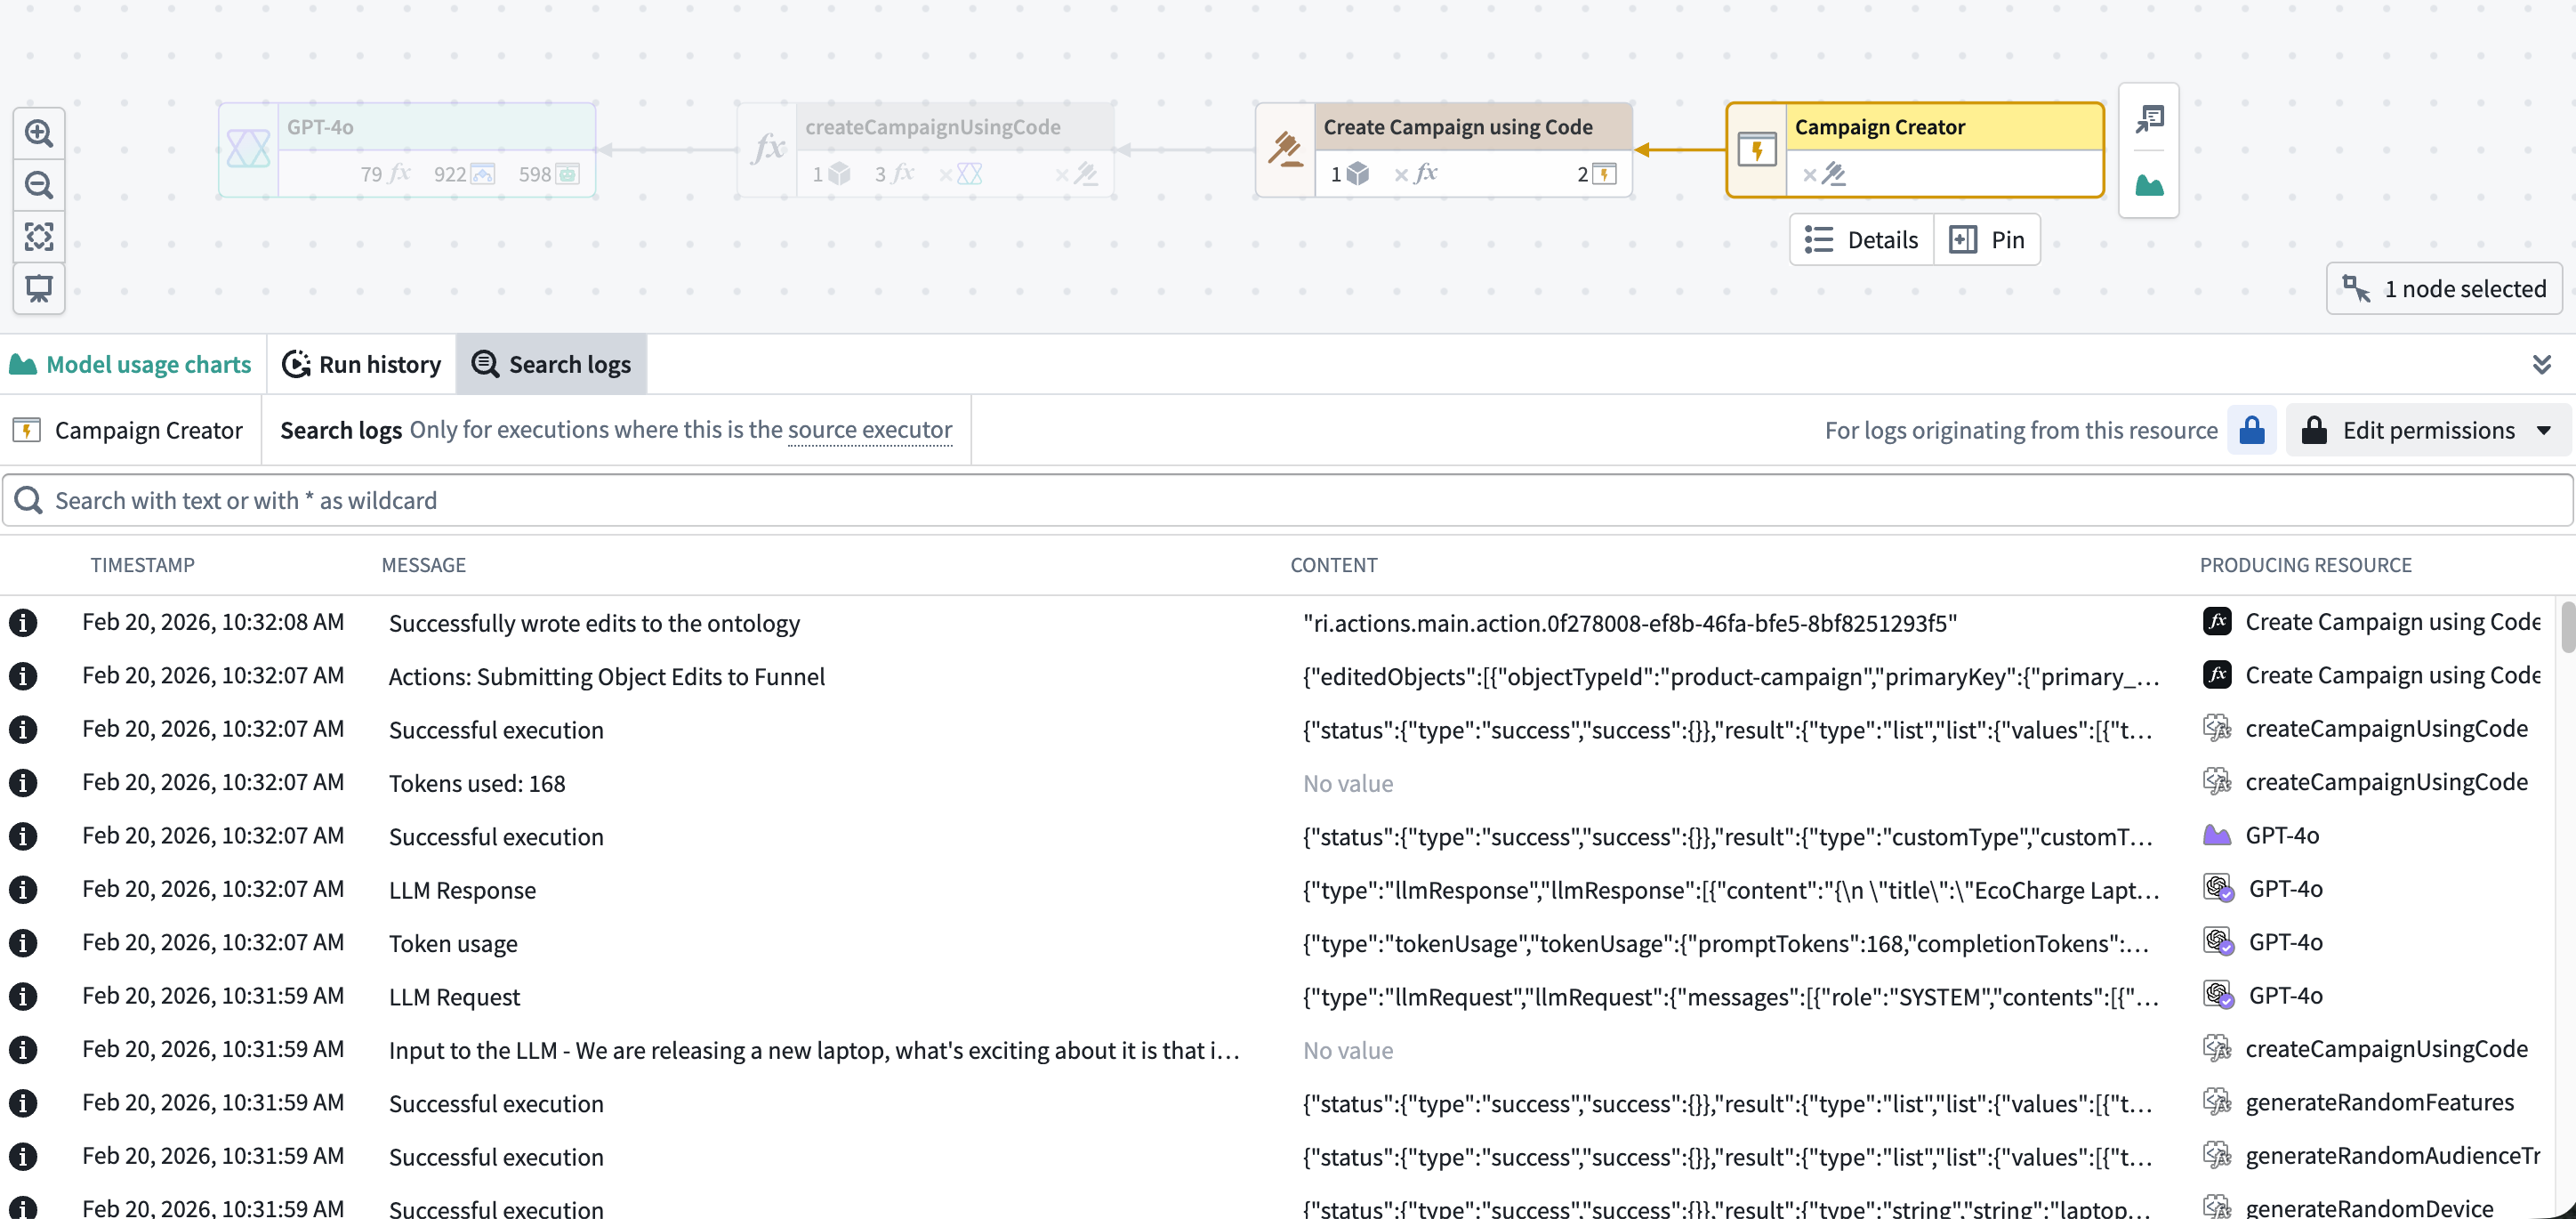
Debug: The Workflow Lineage tool lets you explore and investigate platform history and logs. You can view seven days of execution history, filter by status, user, duration, or version, and pinpoint exactly which executions need attention. Workflow Lineage also enables you to search across logs from all executions for a source executor to find specific log messages, errors, or patterns.
Trace: To visualize the full request journey across functions, actions, and LLM calls, you can use trace views. Trace views enable you to drill into any operation to see duration, inputs, outputs, and errors.
Analyze: To conduct further analysis on log data, you can export Foundry logs, metrics, and traces to a streaming dataset to power your own dashboards, pipelines, or custom observability workflows.
Monitoring
Monitoring tools help you track the health and stability of your resources over time, detect issues proactively, and receive alerts when problems occur.
Data Health is the primary application for monitoring the health of your platform resources. Data Health provides two feature sets:
- Monitoring views: You can monitor Foundry resources at scale using scope-based monitoring rules across projects, folders, applications, or individual resources.
- Health checks: Detailed health checks can be configured on individual resources, including content and schema validation for datasets, schedules, and tables.
Both monitoring views and health checks generate alerts when issues are detected. Alerts can be delivered through Foundry notifications or through external systems such as PagerDuty or Slack.
Metrics
Foundry provides metrics across multiple resource types to help you monitor health and performance over time.
- Functions, actions, and AIP Logic: View near real-time success/failure counts and P95 execution duration over the last 30 days through Ontology Manager or Workflow Lineage.
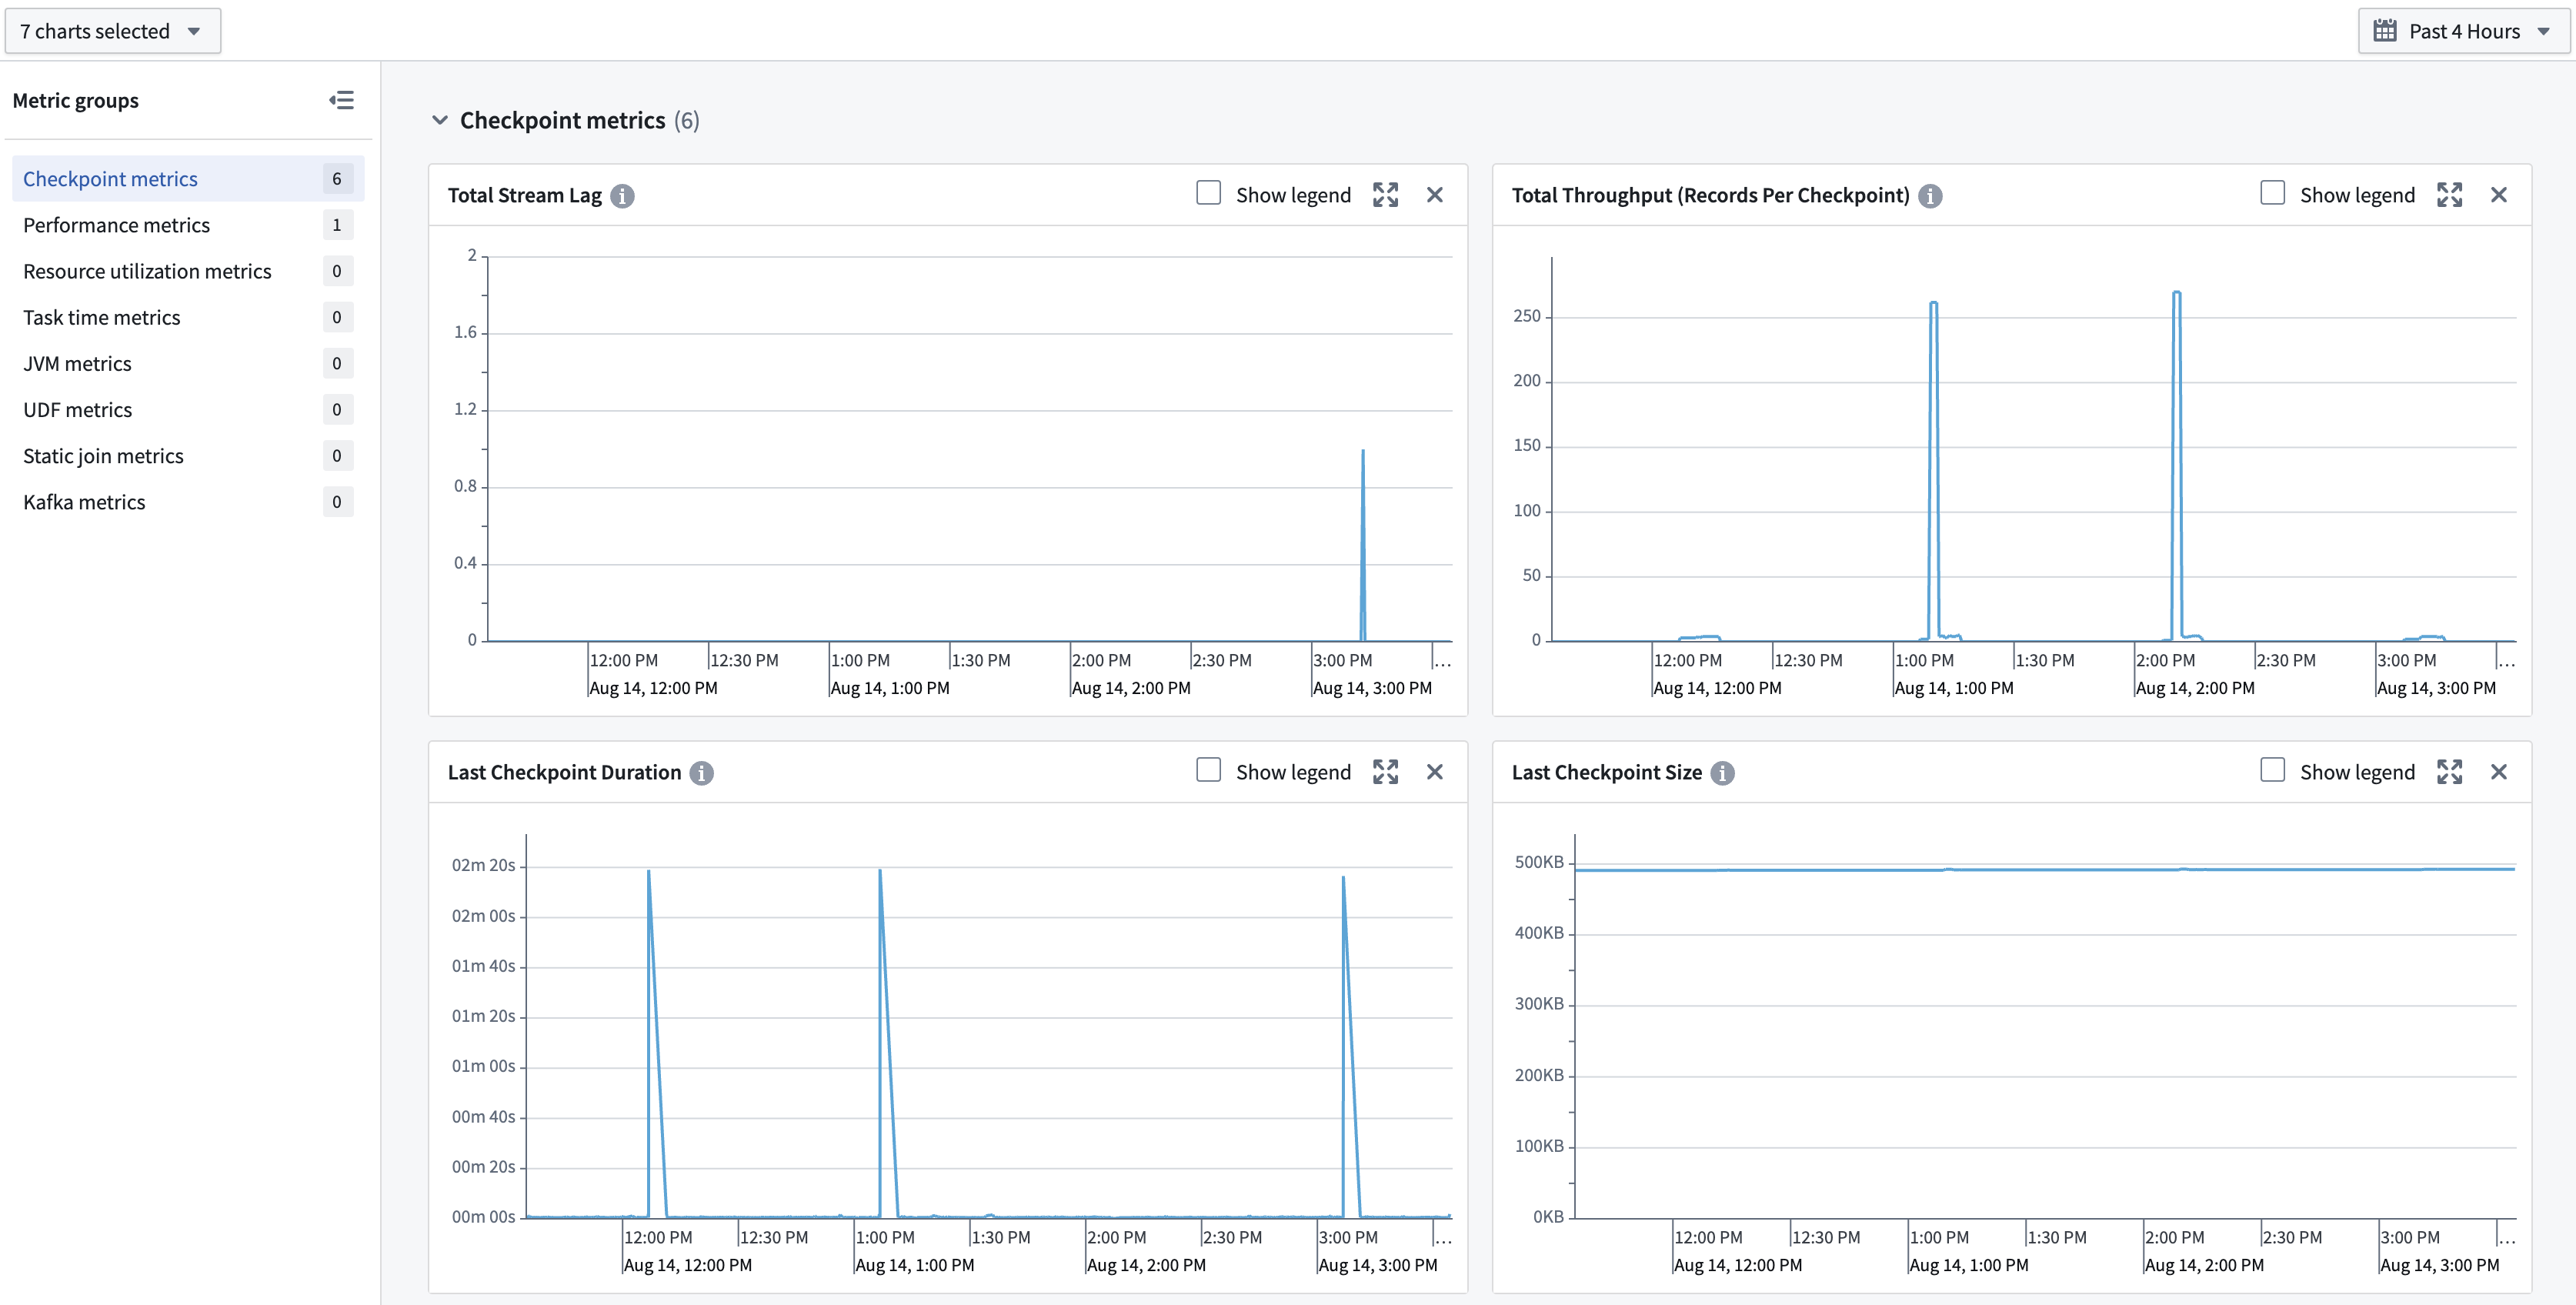
- Streams and compute modules: Access metrics in the Metrics tab to monitor the health and stability of long-running compute workloads.
Debugging
Debugging tools help you investigate issues during development and in production by providing visibility into execution details, logs, and traces.
AIP observability
AIP observability features in Workflow Lineage enable you to gain comprehensive insights into your AIP and Ontology workflow executions. Use AIP observability features to understand the performance of your agents, functions, language models, automations, actions, and Ontology.
AIP observability features can be used to gain visibility into metrics, execution history, distributed tracing, logging, and log search.
Logs
You can view logs from both third-party libraries being used to run your code (such as Kafka when using streams), as well as logs emitted by your code. Logs are available on several types of jobs:
- Batch and streaming transforms: Live logs can be viewed on the transform's job report.
- Compute modules: Logs can be viewed in the Compute Module overview page.
- Functions: Logs can be viewed in Workflow Lineage.
You can also search across logs from all executions for a source executor to find specific log messages, errors, or patterns. A source executor is the first executable resource in the call chain, such as a function, action, automation, AIP Logic, or AIP agent.
Log export
:::callout{theme="warning"} Log exporting may not be available in your enrollment. Contact Palantir Support for more information. :::
To allow for arbitrary processing outside the current capabilities of in-platform tools, you can create a stream in a specified folder containing all telemetry for an organization. This includes logs, metrics, and traces. Data in this stream can be analyzed using Foundry's suite of data analysis tools or exported to third-party systems.
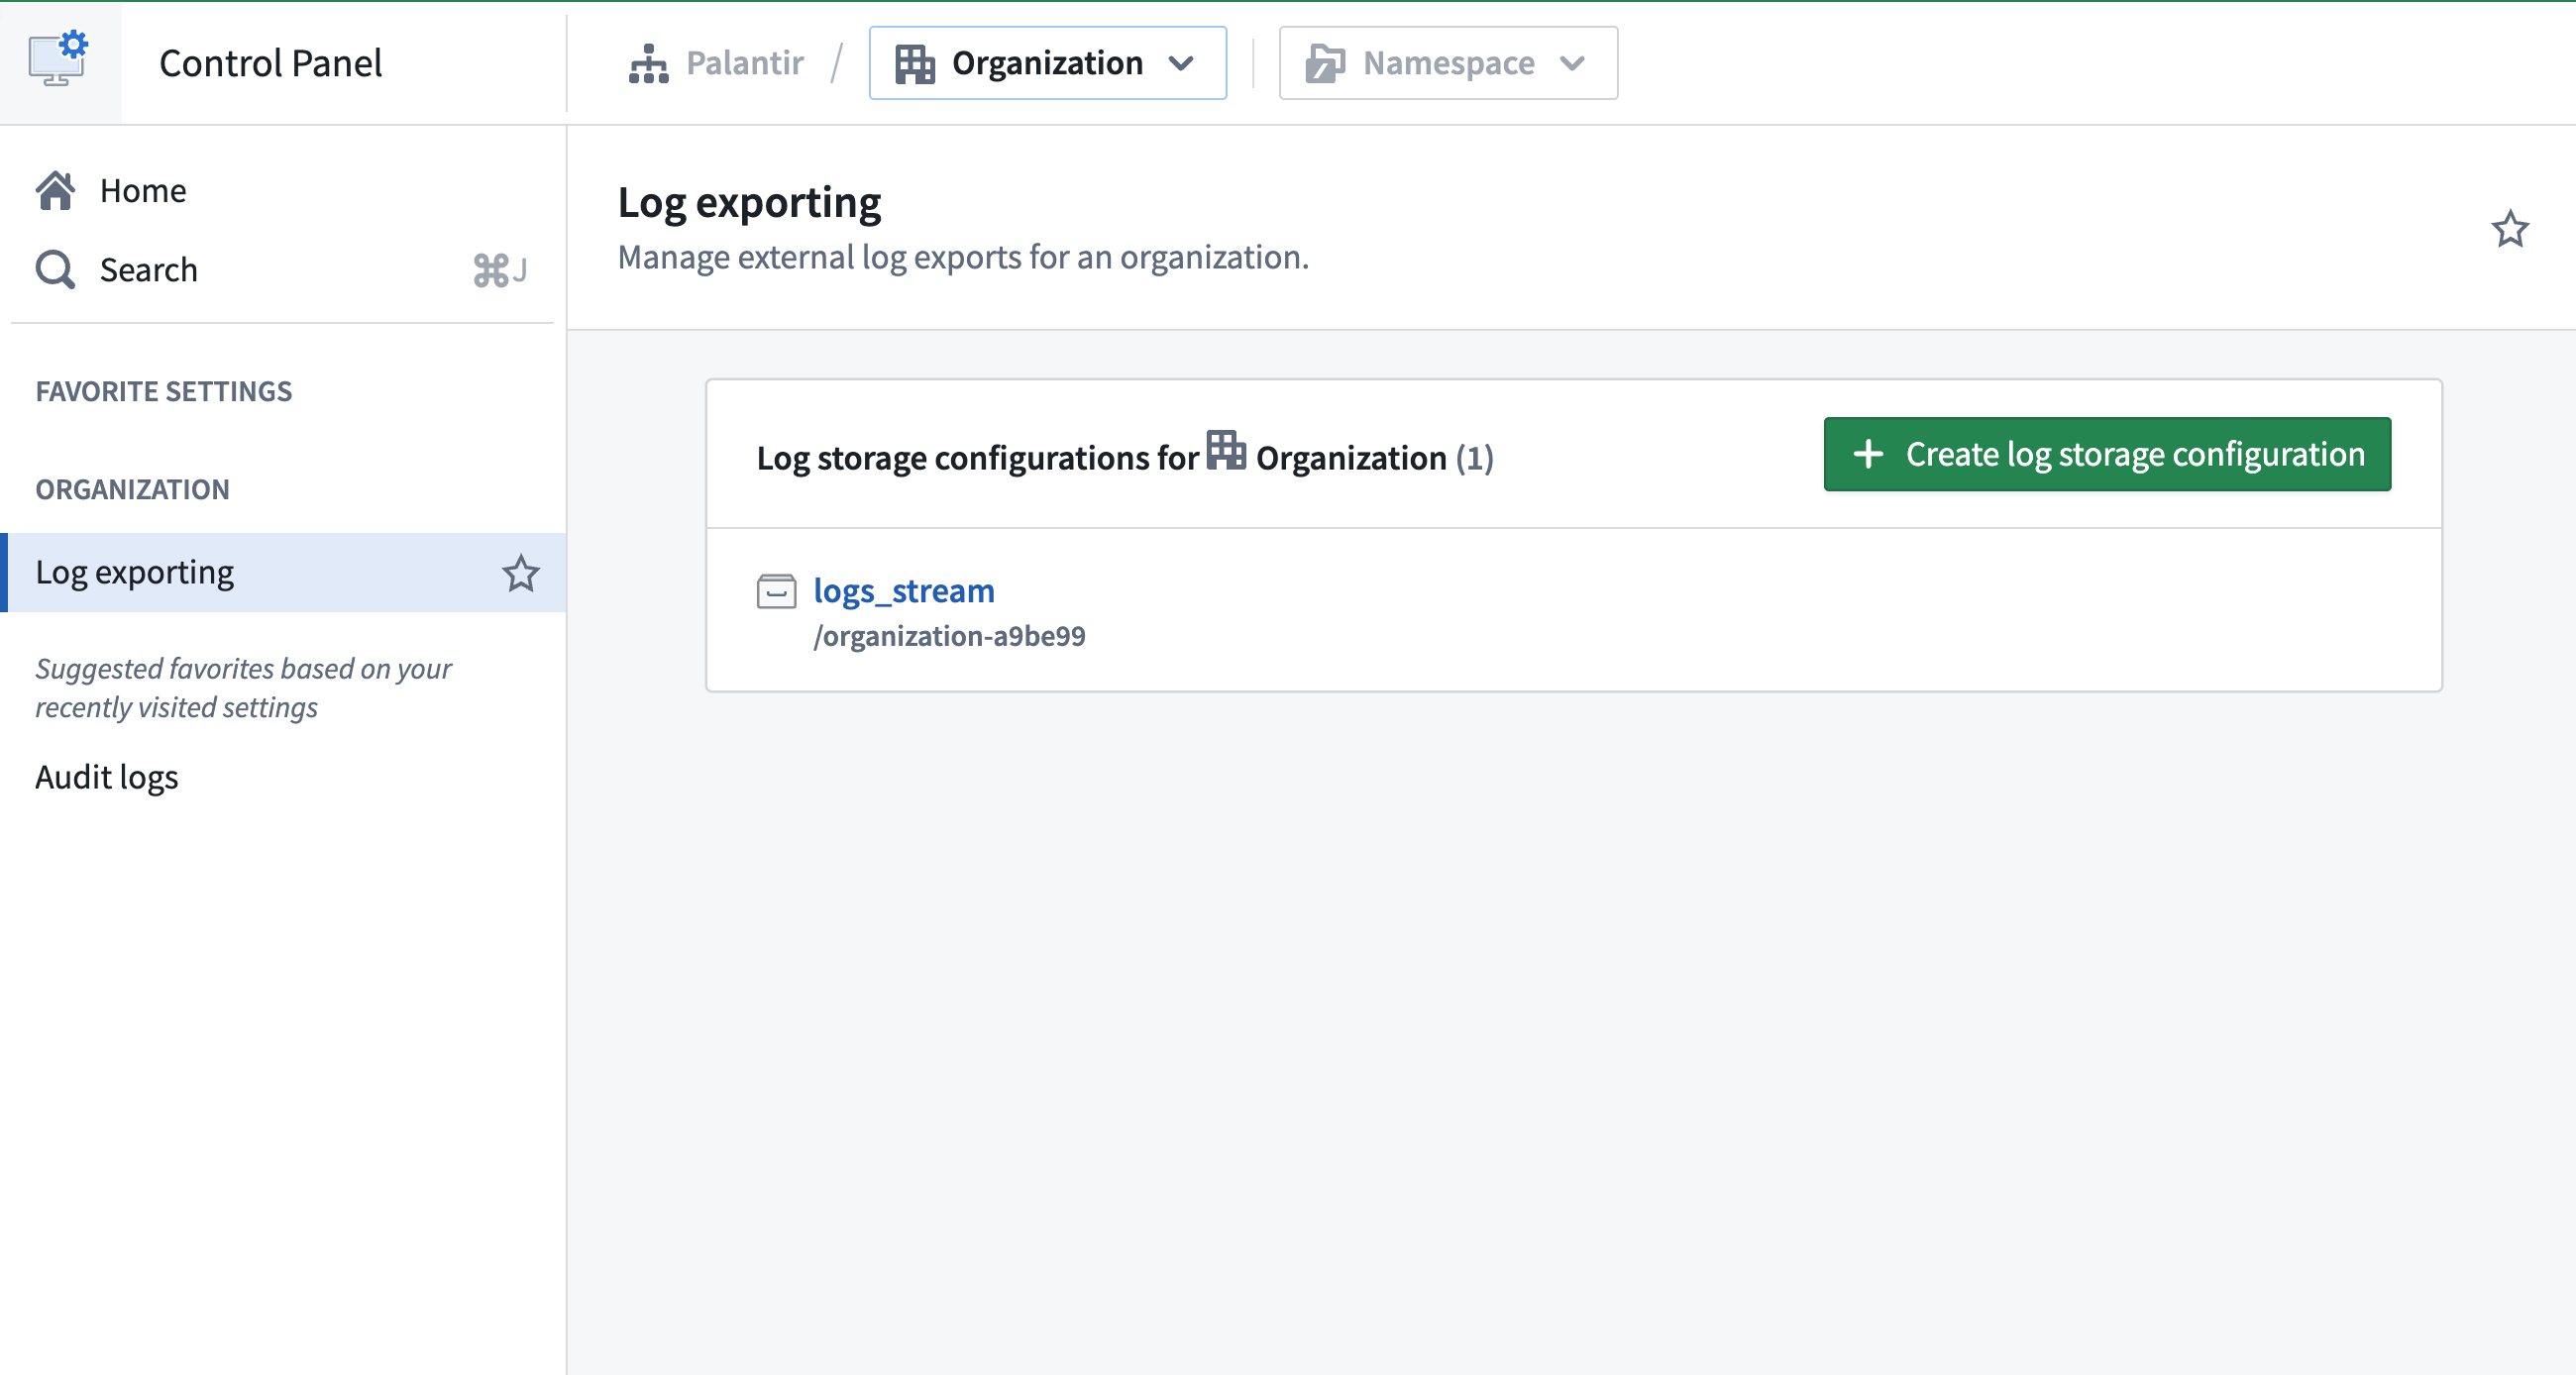
Learn more about exporting logs to a stream on the Configure logging page.
中文翻译
可观测性(Observability)
Palantir 平台提供内置工具,用于监控资源健康状态、调试开发与生产环境中的问题、跨服务追踪执行链路,以及大规模分析遥测数据。
监控(Monitor): 您可以使用数据健康(Data Health)工具监控平台。通过 Data Health,您可以设置规则并定义故障、延迟等指标的阈值;按资源或跨项目批量配置监控器;通过 PagerDuty、Slack、Webhook 或 Foundry 通知接收告警;并查看过去 30 天的执行次数和 P95 延迟指标(metrics)。
调试(Debug): 工作流谱系(Workflow Lineage)工具让您探索和调查平台历史记录与日志。您可以查看七天的执行历史(execution history),按状态、用户、持续时间或版本筛选,并精确定位需要关注的执行记录。Workflow Lineage 还支持跨日志搜索(search across logs),从某个源执行器的所有执行记录中查找特定日志消息、错误或模式。
追踪(Trace): 为可视化跨函数、操作和 LLM 调用的完整请求链路,您可以使用追踪视图(trace views)。Trace views 支持深入查看任意操作的持续时间、输入、输出和错误信息。
分析(Analyze): 如需对日志数据进行进一步分析,您可以将 Foundry 日志、指标和追踪导出(export)到流式数据集,用于构建自定义仪表板、管道或可观测性工作流。
监控(Monitoring)
监控工具帮助您跟踪资源随时间变化的健康状态和稳定性,主动发现问题,并在故障发生时接收告警。
数据健康(Data Health)是监控平台资源健康状态的主要应用。Data Health 提供两大功能集:
- 监控视图(Monitoring views): 您可以使用基于作用域的监控规则,跨项目、文件夹、应用或单个资源大规模监控 Foundry 资源。
- 健康检查(Health checks): 可为单个资源配置详细的健康检查,包括数据集、调度任务和表的内容与模式验证。
监控视图和健康检查在检测到问题时都会生成告警。告警可通过 Foundry 通知或外部系统(external systems)(如 PagerDuty 或 Slack)发送。
指标(Metrics)
Foundry 提供跨多种资源类型的指标,帮助您监控长期健康状态和性能。
- 函数(Functions)、操作(actions)和 AIP Logic: 通过本体管理器(Ontology Manager)或工作流谱系(Workflow Lineage)查看近实时的成功/失败计数以及过去 30 天的 P95 执行持续时间。
- 流和计算模块(Streams and compute modules): 在 指标(Metrics) 选项卡中访问指标,监控长时间运行的计算工作负载的健康状态和稳定性。
调试(Debugging)
调试工具通过提供执行详情、日志和追踪的可视化能力,帮助您在开发和生产环境中调查问题。
AIP 可观测性(AIP observability)
工作流谱系(Workflow Lineage)中的 AIP 可观测性(AIP observability)功能使您能够全面洞察 AIP 和本体工作流的执行情况。使用 AIP 可观测性功能了解代理、函数、语言模型、自动化、操作和本体的性能。
AIP 可观测性功能可用于获取指标(metrics)、执行历史(execution history)、分布式追踪(distributed tracing)、日志记录(logging)和日志搜索(log search)的可视化能力。
日志(Logs)
您可以查看用于运行代码的第三方库(例如使用流时的 Kafka)生成的日志,以及代码自身输出的日志。日志在以下类型的作业中可用:
- 批处理和流式转换(Batch and streaming transforms): 可在转换的作业报告中查看实时日志。
- 计算模块(Compute modules): 可在计算模块概览页面查看日志。
- 函数(Functions): 可在工作流谱系中查看日志。
您还可以跨日志搜索(search across logs),从某个源执行器的所有执行记录中查找特定日志消息、错误或模式。源执行器(source executor)是调用链中的第一个可执行资源,例如函数、操作、自动化、AIP Logic 或 AIP 代理。
日志导出(Log export)
:::callout{theme="warning"} 日志导出功能可能在您的环境中不可用。请联系 Palantir 支持以获取更多信息。 :::
为支持在平台内置工具现有能力之外进行任意处理,您可以在指定文件夹中创建一个包含组织所有遥测数据的流。这包括日志、指标和追踪。该流中的数据可使用 Foundry 的数据分析工具套件进行分析,或导出到第三方系统。