Debug transforms(调试转换(Debug transforms))
The Palantir extension for Visual Studio Code supports inspecting variables when debugging Python transforms. Complex data structures such as DataFrames can be loaded into the extension's Preview panel, allowing you to verify transform accuracy and identify issues before initializing a build.
Start a debug session
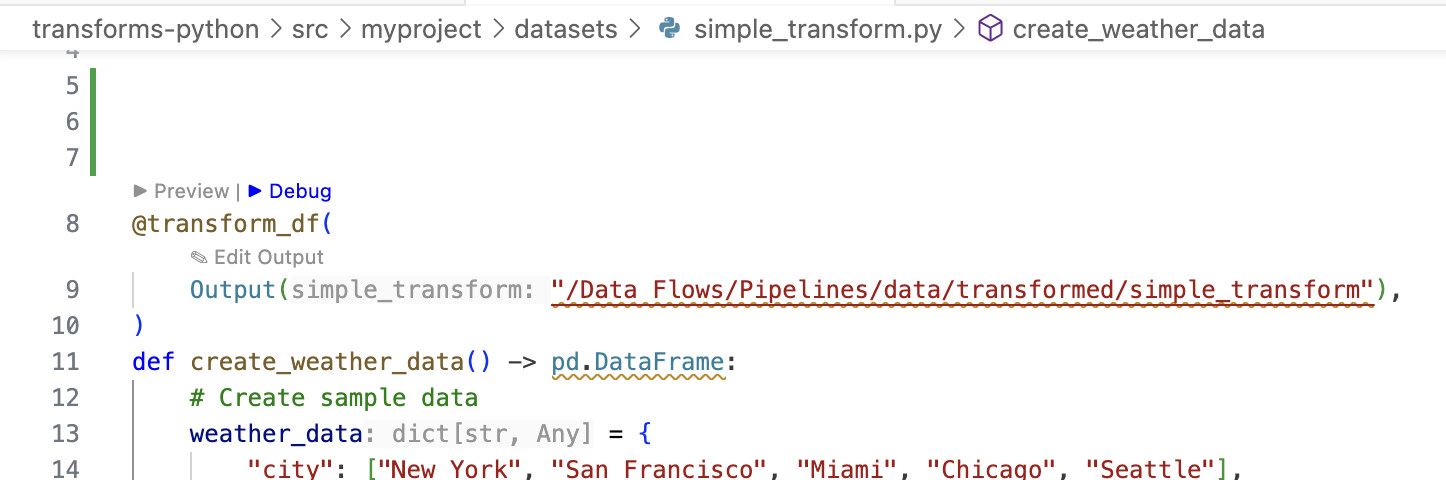
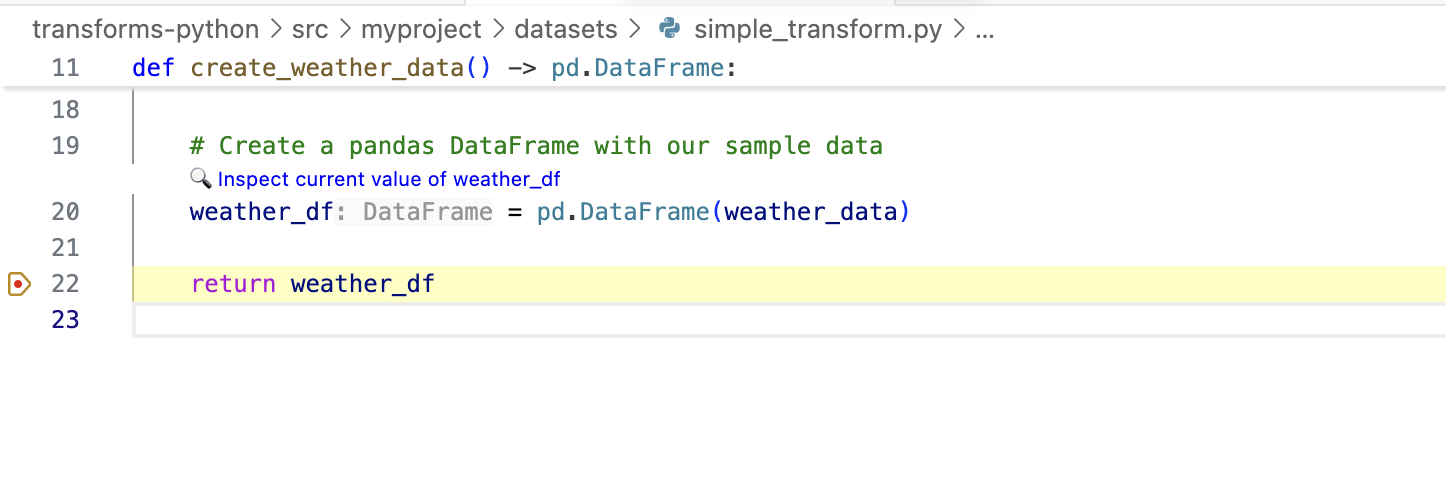
To use debugging features with the Palantir extension for Visual Studio Code, open a Python file containing a transform. Set at least one breakpoint in your code to pause execution when that code is executed. When the breakpoint is reached, Visual Studio Code's Debug panel will open automatically and display the variables currently in scope.
To start a debug session, select Debug above the transform.
When a breakpoint is reached in your debugging session, you can inspect supported variables using the Preview panel through the following two methods:
- Select 🔎 Inspect current value of … above the variable you wish to inspect
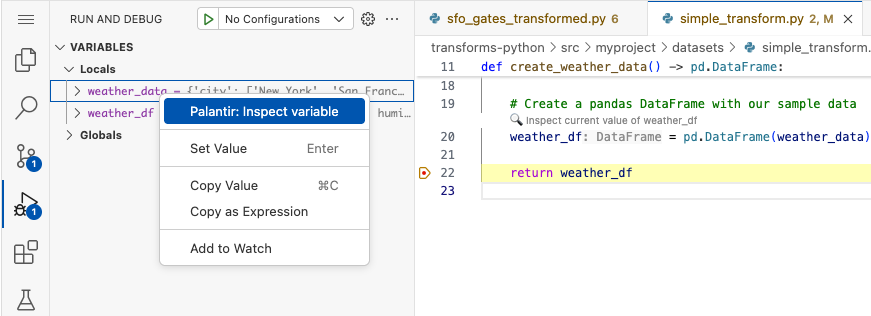
- Right-click on the variable in Visual Studio Code's Debug panel and select Palantir: Inspect variable.
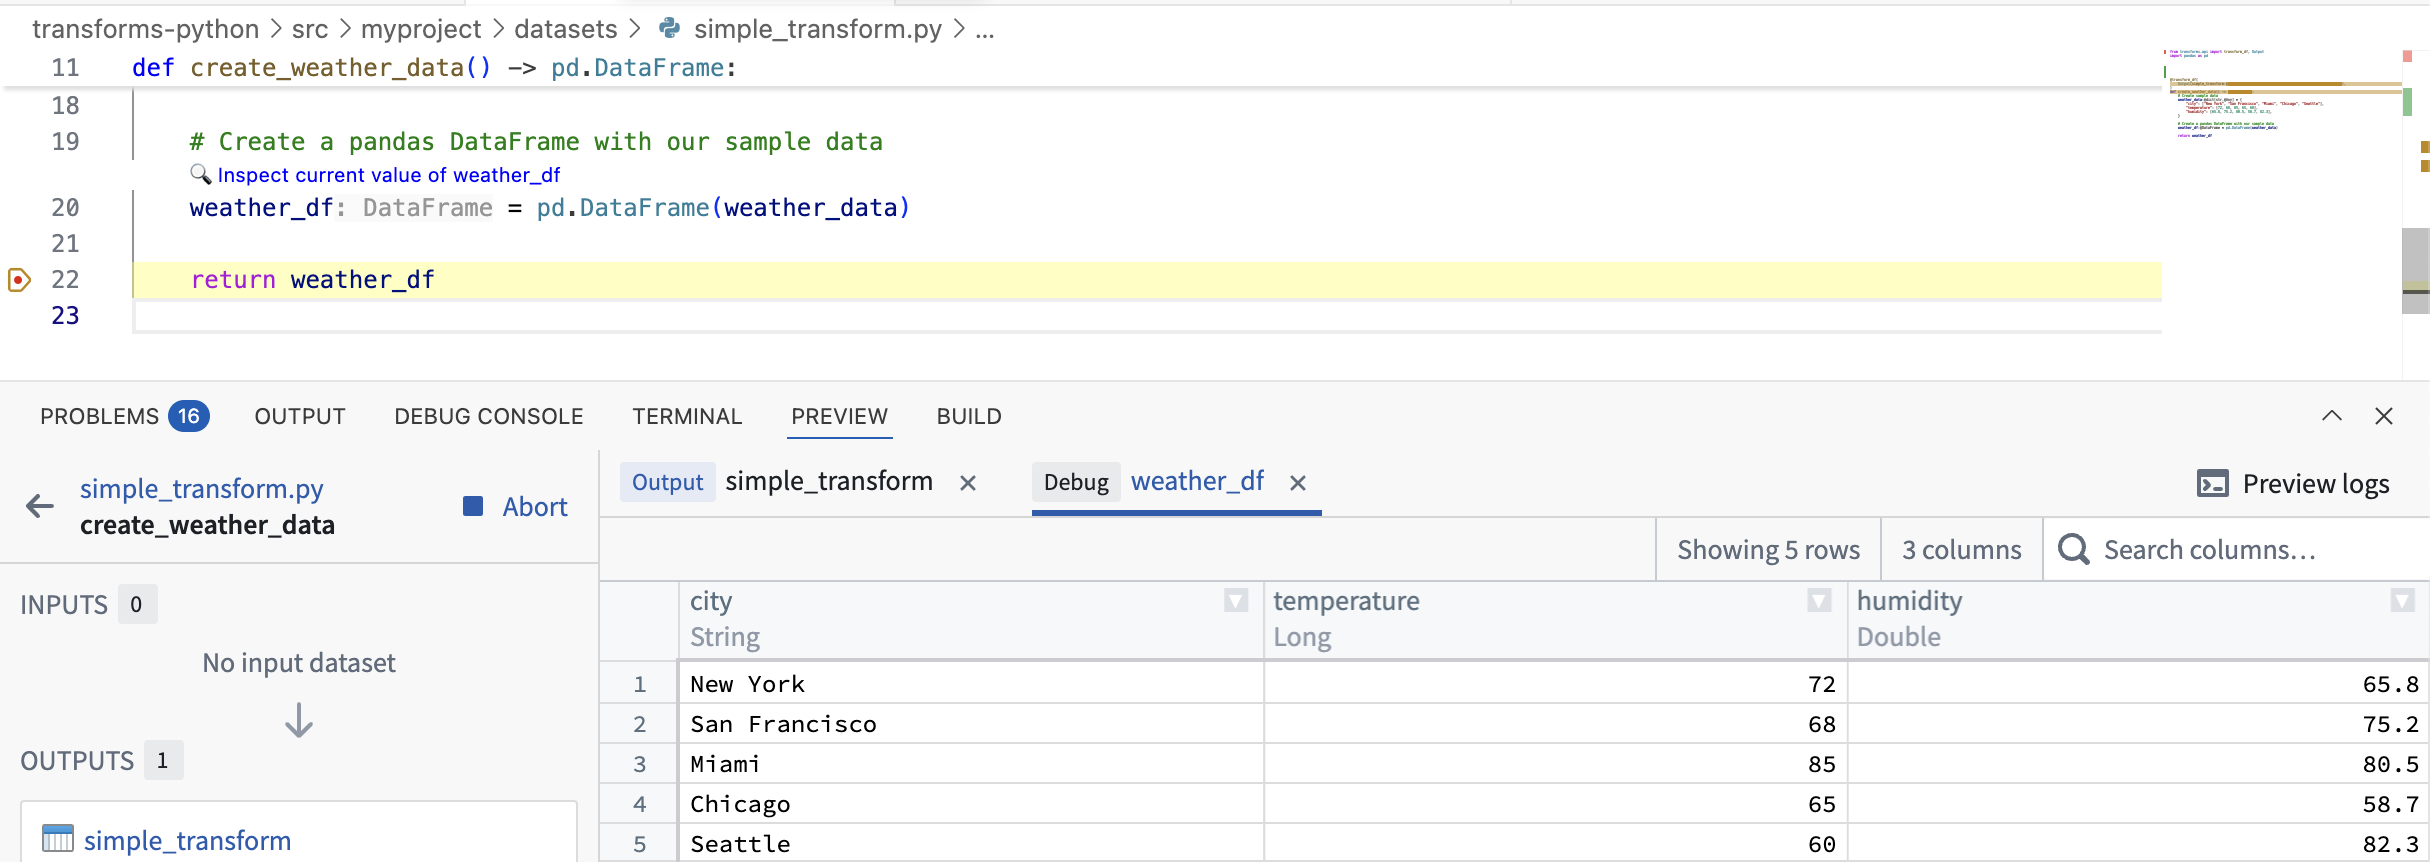
Inspecting a variable will load it into the extension's Preview panel. You can then view the variable's contents and use the Preview panel's features to explore the data, such as viewing column statistics.
中文翻译
调试转换(Debug transforms)
Visual Studio Code 的 Palantir 扩展支持在调试 Python 转换时检查变量。诸如 DataFrame 等复杂数据结构可加载至扩展的预览(Preview)面板,帮助您在启动构建前验证转换准确性并识别问题。
启动调试会话
要使用 Visual Studio Code 的 Palantir 扩展进行调试,请打开包含转换的 Python 文件。在代码中至少设置一个断点,以便执行到该代码时暂停运行。当断点被触发时,Visual Studio Code 的调试(Debug)面板将自动打开并显示当前作用域内的变量。
要启动调试会话,请点击转换上方的调试(Debug)选项。
当调试会话中触发断点时,您可以通过以下两种方法使用预览面板检查支持的变量:
- 点击待检查变量上方的 🔎 检查当前值…(Inspect current value of …)
- 右键点击 Visual Studio Code 调试面板中的变量,选择 Palantir:检查变量(Palantir: Inspect variable)。
检查变量会将其加载至扩展的预览面板。您可以查看变量内容,并利用预览面板的功能探索数据,例如查看列统计信息。