The Pilot workspace(Pilot 工作区)
The Pilot workspace is where you interact with AI agents to build, preview, and refine your application. This page describes each area of the workspace.
Workspace layout
The workspace is divided into two main areas:
- Chat panel (left): The AI chat interface where you provide instructions, view agent activity, and manage context attachments
- Application view (center): Tabbed views for previewing, inspecting, and debugging your application
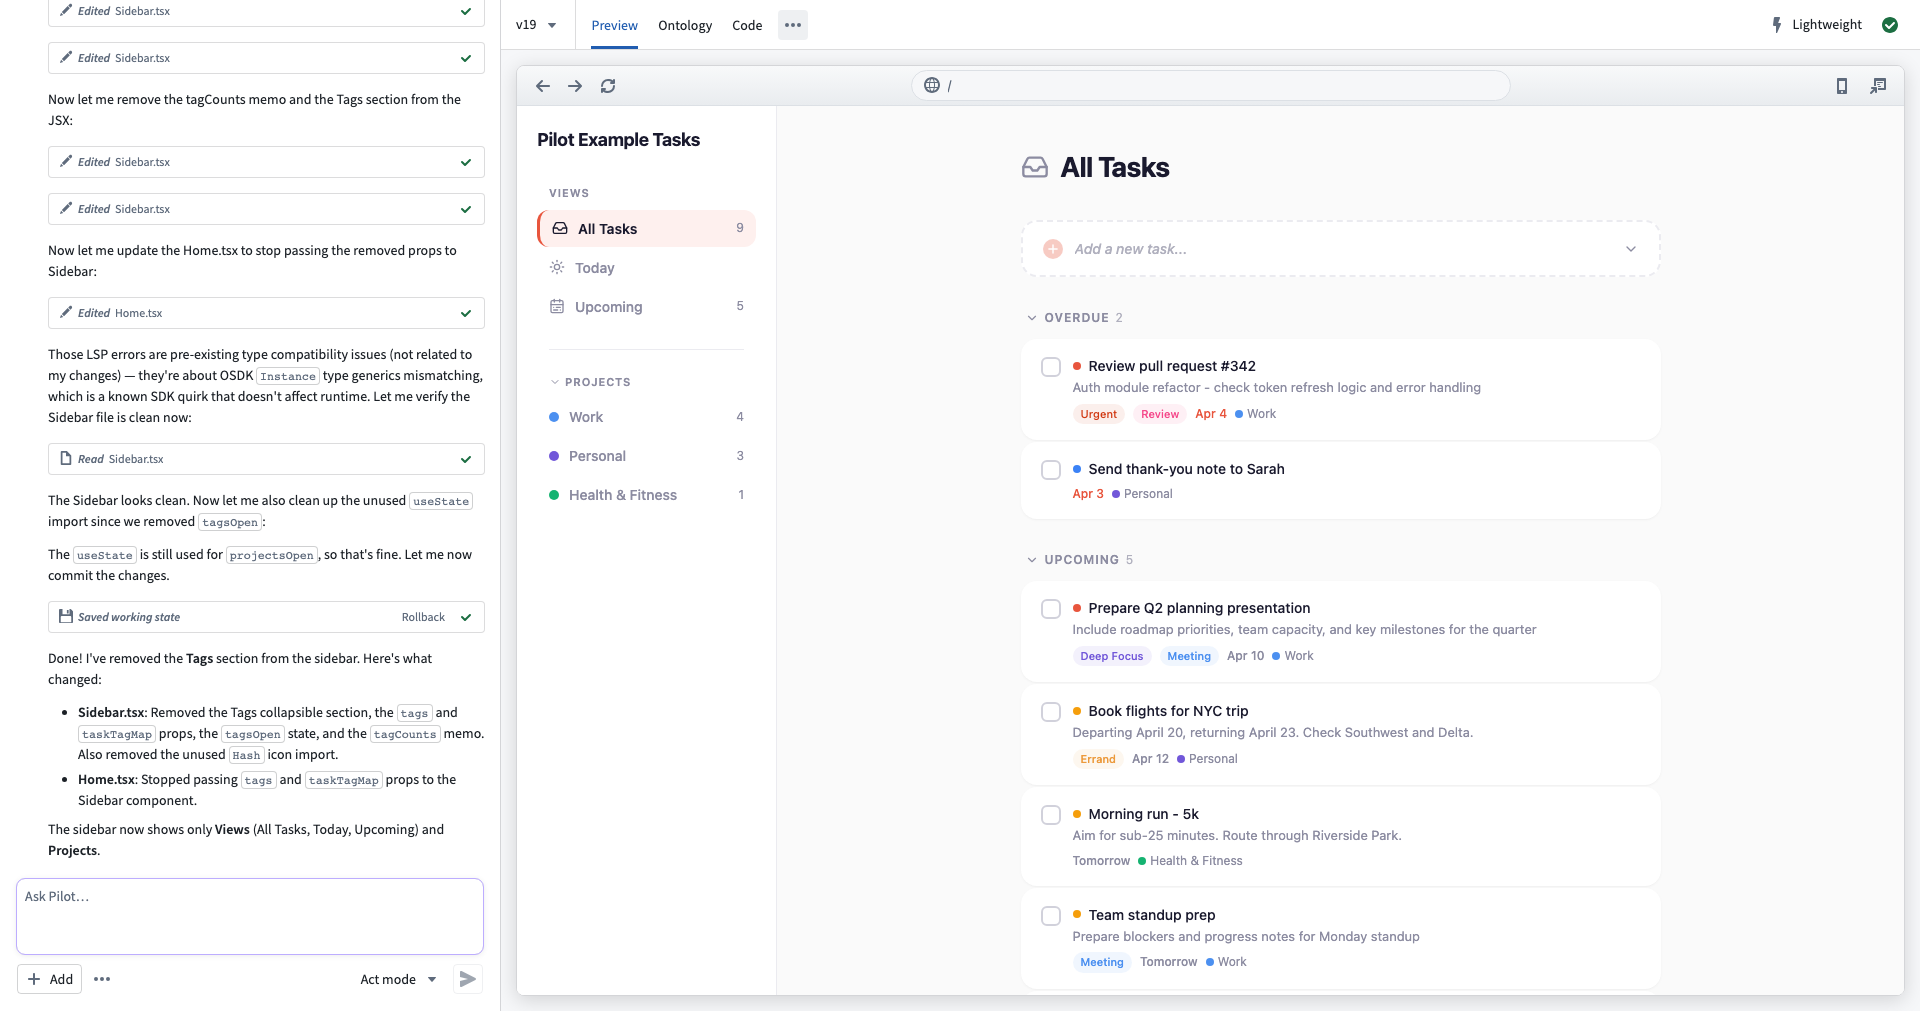
Chat panel
The chat panel is your primary interface for communicating with Pilot. It includes the following:
- Message history: Displays your prompts, agent responses, tool executions, and reasoning steps. Pilot shows what each agent is doing in real time, including file reads, edits, and bash commands.
- Prompt input: A text area at the bottom where you can type instructions. Select Send or press
Enterto submit your prompt. - Add menu: Select Add to attach context to your prompt, including existing ontology entities, documents, and images. See Provide context and attachments for details.
- More menu: Select the More menu for additional options, including model selection and clearing the chat history. For details on available models, see Models and agent modes.
When Pilot spawns a specialized subagent such as the designer or ontology architect, the chat panel displays a separate thread for that subagent's activity. You can switch between the main thread and subagent threads to follow their work.
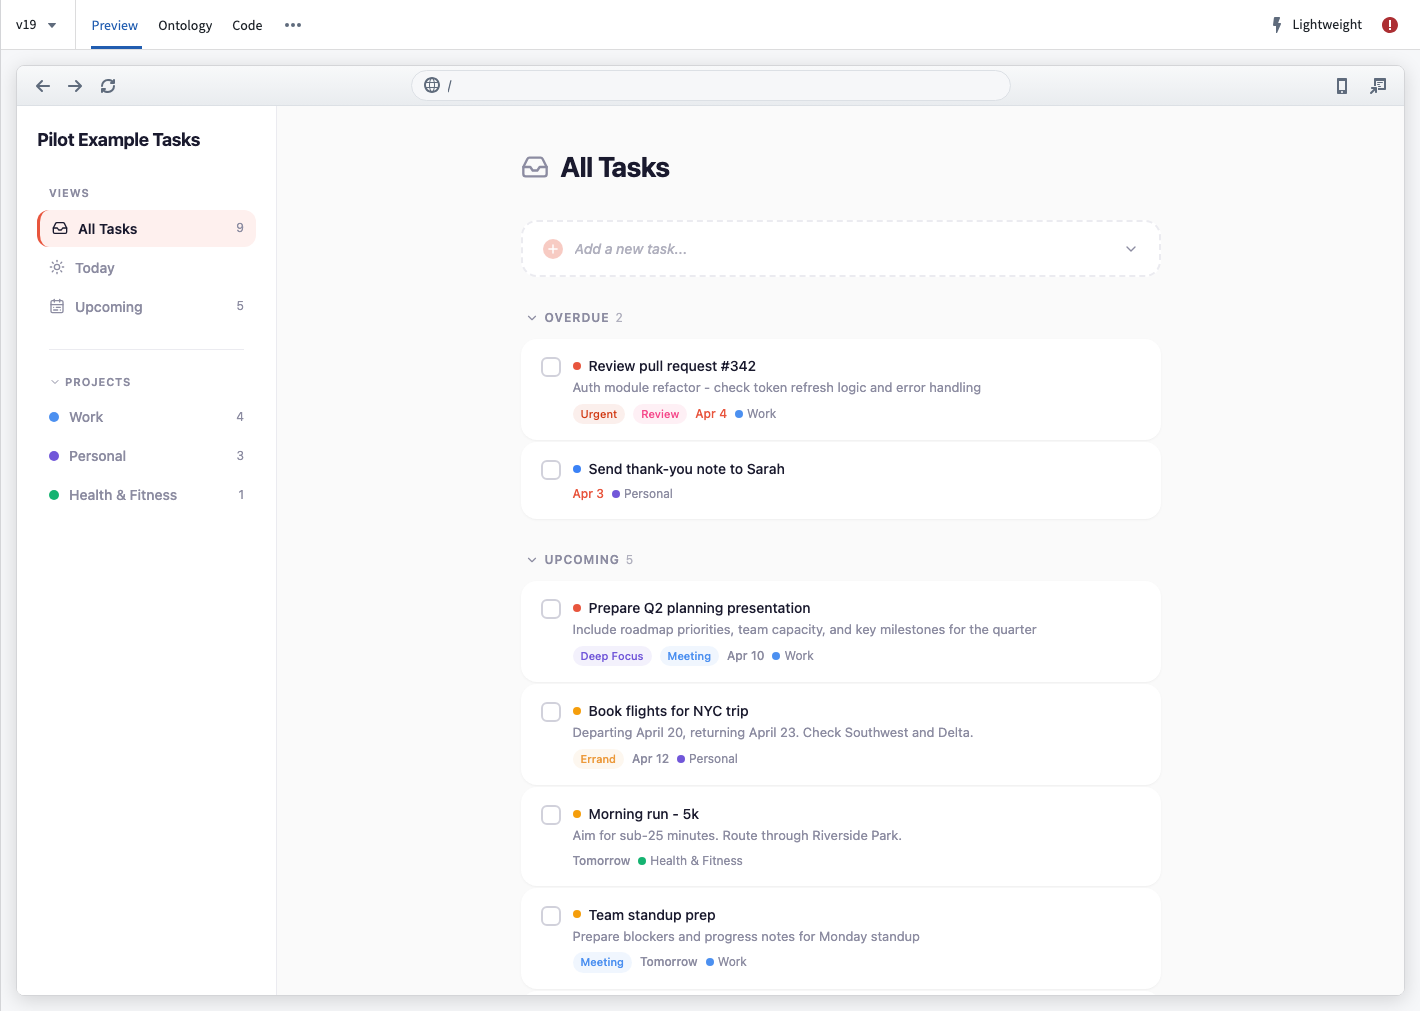
Preview tab
The Preview tab displays a live preview of your generated application running inside the provisioned container. The preview updates automatically when Pilot modifies application code.
The Preview tab includes a browser-style toolbar with the following features:
- Navigation buttons: Back, forward, and reload controls for navigating within the preview.
- URL bar: Displays the current preview URL.
- Device selector: Switch between desktop, tablet, and mobile viewport sizes to preview your application at different screen sizes. The preview auto-scales to fit the selected device frame.
:::callout{theme="neutral"}
In editor view, the preview uses seed data from the Pilot container. In deploy view, your application connects to real ontology data. On a deployment branch, schema changes are scoped to that branch; on Main, any actions are live ontology edits.
:::
Ontology tab
The Ontology tab displays an interactive graph of the object types, action types, and relationships that Pilot created for your application. For a detailed walkthrough, see the ontology tab documentation.
Code tab
The Code tab provides an embedded code editor where you can view and edit the source code for your generated application. The editor uses the same interface as Code Workspaces. You can also make code changes through the chat interface.
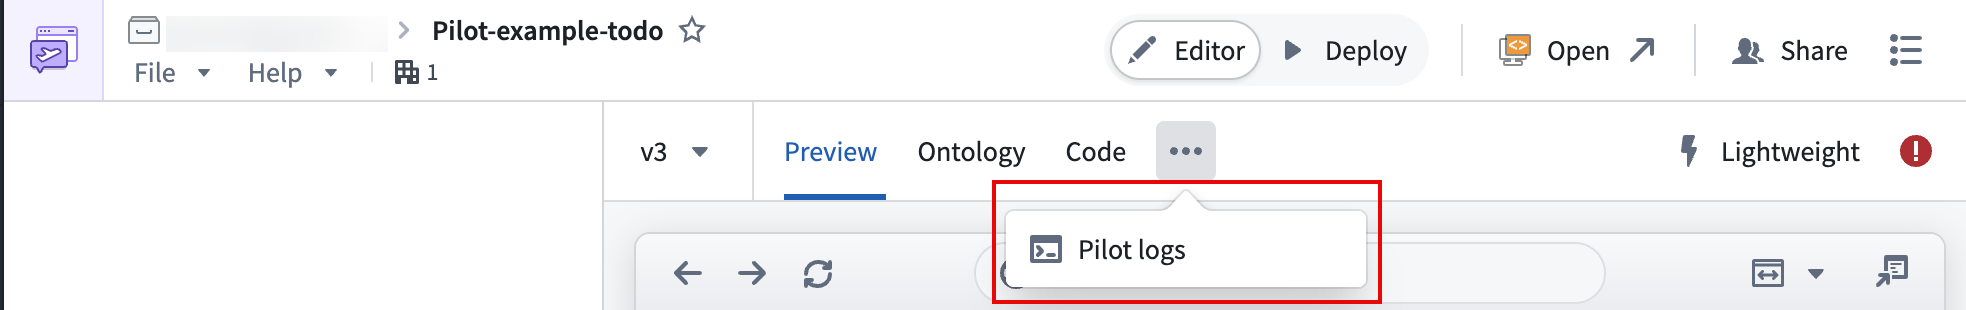
More tab (...)
The More (...) tab currently has one item, Pilot logs, which display real-time container logs from the Pilot development server. Use this tab for the following actions:
- Monitor build output and compilation status.
- Debug runtime errors.
- View dependency installation progress.
You can copy log contents to the clipboard using the copy button.
Content header
The content header sits above the tab views and provides the following features:
- Editor/Deploy toggle: Switch between editor view (seed data) and deploy view (real ontology data). For details, see Deploy an application.
- Version selector: View and switch between versions of your application.
- Tab navigation: Switch between Preview, Ontology, Code, and Pilot logs tabs.
- Status indicator: Select to open the status monitoring popover.
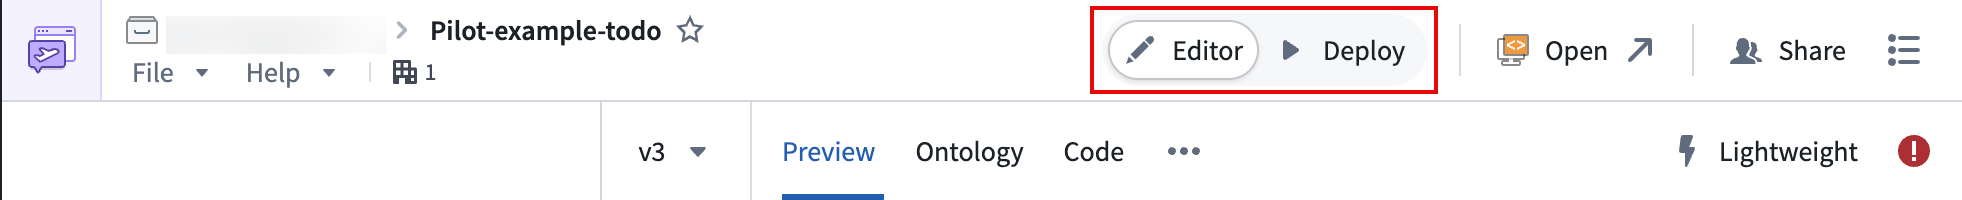
Editor and deploy views
The Editor/Deploy toggle in the content header controls which data your application displays.
- Editor view: Shows your application with seed data generated inside the Pilot container. This is the default view while building. Seed data prevents AI agents from accessing or hard-coding real enterprise data.
- Deploy view: Shows your application against real ontology data on a branch. Use this view to validate that your application works correctly with production data before releasing.
For a complete walkthrough of the deployment process, see Deploy an application.
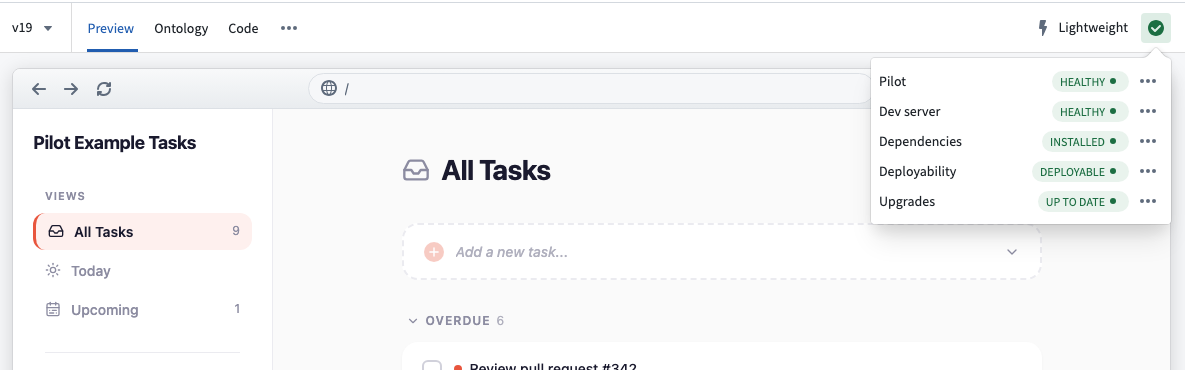
Status monitoring
The status indicator in the top-right corner of the content header shows the overall health of your Pilot session. Select it to open the status monitoring popover, which displays the following information:
- Pilot status: Whether the Pilot connection is healthy or disconnected.
- Development server: Whether the development server is running, inactive, or has build errors.
- Dependencies: Whether package dependencies are installed, installing, or failed.
- Deployability: Whether the application is ready to deploy, not deployable, or has invalid ontology entities.
- Upgrades: Whether dependencies are up to date or outdated.
Each status item includes an action to resolve issues. For most problems, you can select Fix with Pilot to prompt Pilot to diagnose and apply a fix automatically.
中文翻译
Pilot 工作区
Pilot 工作区是您与 AI 智能体(AI agent)交互,以构建、预览和优化应用程序的地方。本页面介绍工作区的各个区域。
工作区布局
工作区分为两个主要区域:
- 聊天面板(左侧):AI 聊天界面,您可以在其中提供指令、查看智能体活动并管理上下文附件(context attachment)
- 应用视图(中央):用于预览、检查和调试应用程序的标签页视图
聊天面板
聊天面板是您与 Pilot 通信的主要界面。它包含以下内容:
- 消息历史: 显示您的提示词、智能体响应、工具执行和推理步骤。Pilot 会实时显示每个智能体的操作,包括文件读取、编辑和 bash 命令。
- 提示输入框: 底部的文本区域,您可以在其中输入指令。选择发送或按下
Enter键提交您的提示词。 - 添加菜单: 选择添加可将上下文附加到您的提示词中,包括现有的本体实体(ontology entity)、文档和图片。详情请参阅提供上下文和附件。
- 更多菜单: 选择更多菜单可获取其他选项,包括模型选择和清除聊天历史。有关可用模型的详细信息,请参阅模型和智能体模式。
当 Pilot 生成专门的子智能体(subagent),如设计师或本体架构师时,聊天面板会为该子智能体的活动显示单独的线程。您可以在主线程和子智能体线程之间切换以跟踪它们的工作。
预览标签页
预览标签页显示在预配容器中运行的生成应用程序的实时预览。当 Pilot 修改应用程序代码时,预览会自动更新。
预览标签页包含一个浏览器风格的工具栏,具有以下功能:
- 导航按钮: 用于在预览中导航的后退、前进和刷新控件。
- URL 栏: 显示当前预览 URL。
- 设备选择器: 在桌面、平板和移动视口大小之间切换,以在不同屏幕尺寸下预览您的应用程序。预览会自动缩放以适应所选设备框架。
:::callout{theme="neutral"}
在编辑器视图中,预览使用 Pilot 容器中的种子数据(seed data)。在部署视图中,您的应用程序连接到真实的本体数据。在部署分支上,模式更改仅限于该分支;在 Main 上,任何操作都是对本体的实时编辑。
:::
本体标签页
本体标签页显示一个交互式图表,展示 Pilot 为您的应用程序创建的对象类型(object type)、操作类型(action type)和关系。有关详细说明,请参阅本体标签页文档。
代码标签页
代码标签页提供一个嵌入式代码编辑器,您可以在其中查看和编辑生成的应用程序的源代码。该编辑器使用与 Code Workspaces 相同的界面。您也可以通过聊天界面进行代码更改。
更多标签页(...)
更多(...)标签页目前包含一个项目:Pilot 日志,显示来自 Pilot 开发服务器的实时容器日志。使用此标签页可执行以下操作:
- 监控构建输出和编译状态。
- 调试运行时错误。
- 查看依赖项安装进度。
您可以使用复制按钮将日志内容复制到剪贴板。
内容标题栏
内容标题栏位于标签视图上方,提供以下功能:
- 编辑器/部署切换: 在编辑器视图(种子数据)和部署视图(真实本体数据)之间切换。详情请参阅部署应用程序。
- 版本选择器: 查看和切换应用程序的版本。
- 标签导航: 在预览、本体、代码和 Pilot 日志标签页之间切换。
- 状态指示器: 选择以打开状态监控弹出窗口。
编辑器视图和部署视图
内容标题栏中的编辑器/部署切换控件控制您的应用程序显示哪些数据。
- 编辑器视图: 显示使用 Pilot 容器内生成的种子数据的应用程序。这是构建时的默认视图。种子数据可防止 AI 智能体访问或硬编码真实的企业数据。
- 部署视图: 显示针对分支上的真实本体数据的应用程序。使用此视图可在发布前验证您的应用程序是否与生产数据正确配合工作。
有关部署过程的完整说明,请参阅部署应用程序。
状态监控
内容标题栏右上角的状态指示器显示 Pilot 会话的整体运行状况。选择它以打开状态监控弹出窗口,其中显示以下信息:
- Pilot 状态: Pilot 连接是否正常或已断开。
- 开发服务器: 开发服务器是否正在运行、处于非活动状态或存在构建错误。
- 依赖项: 包依赖项是否已安装、正在安装或安装失败。
- 可部署性: 应用程序是否可部署、不可部署或存在无效的本体实体。
- 升级: 依赖项是否是最新或已过时。
每个状态项都包含一个用于解决问题的操作。对于大多数问题,您可以选择使用 Pilot 修复,让 Pilot 自动诊断并应用修复。