Analyze and monitor a process(分析与监控流程)
The Machinery widget provides operational insights and monitoring capabilities for your configured Machinery processes.
- Gain visibility into process operations when users are actively working within processes.
- Identify bottlenecks for analytical and monitoring workflows.
- Visualize process flows and metrics through configurable views.
The widget renders your Machinery graph in Workshop applications as a visualization that can display metrics, process flows, and object distributions.
The Machinery widget is available in Workshop modules or as a stand-alone view mode in the Machinery application with limited features.
Widget configuration
Create or open a Workshop module and select the Machinery Overview widget. The widget version v2 is selected by default and supports Machinery v2 resources. At the top of the widget configuration, select your Machinery graph resource.
Upgrade existing applications
New Machinery widgets will be created as v2 widgets by default. Existing widgets will need to be upgraded to v2.
- To upgrade a legacy widget to v2, open Workshop edit mode with the ... dropdown menu.
- Select anywhere in the graph, and under the Widget setup menu, select Use Machinery v2.
- Update your inputs appropriately.

Inputs
Configure an input object set for each root process in your graph. The Machinery widget automatically derives subprocess object sets from the link type setup, and subprocesses have link types to their parent objects, as configured under Object type.
Example: If you provide 100 application objects, and each application is linked to multiple review objects, the widget automatically identifies all related reviews through the configured link types. This means that you only need to configure the object input for each root process of the graph (typically 1 object input).
Metric views
The Machinery widget is instantiated with the following pre-configured metric views:
- Historical count: Show ever count metrics.
- Current count: Show current count in state.
- Historical duration: Show historical duration in the state.
- Current duration: Show current duration in the state.
Application builders can add, remove, reorganize or customize these metrics views.

Custom views may also be added using the + Add item option. For each view, a builder can define one node metric with numerical formatting and conditional coloring, an optional edge metric, and enable Sankey diagram edge thickness settings.
Outputs
Output datasets can be used for further analysis within the Workshop module. Configure output object sets to capture filtered results based on graph interactions:
- Create one output per process in the graph (optional)
- The output object set applies filters defined on the process level in the Machinery application as well as search arounds from parent to child processes.
- Outputs respond dynamically to node/edge selection
- Path explorer and distribution charts provide additional means of affecting the output
Node and edge selection
You can change how node selection affects the object output by toggling either of the options:
- Processes currently in selected states
- Processes ever in selected states
Edge selection can be configured to show objects that ever went through a transition or just the last transition.
Configure views
Views determine what metrics and visualizations appear in the widget. See the metric views section below for details.
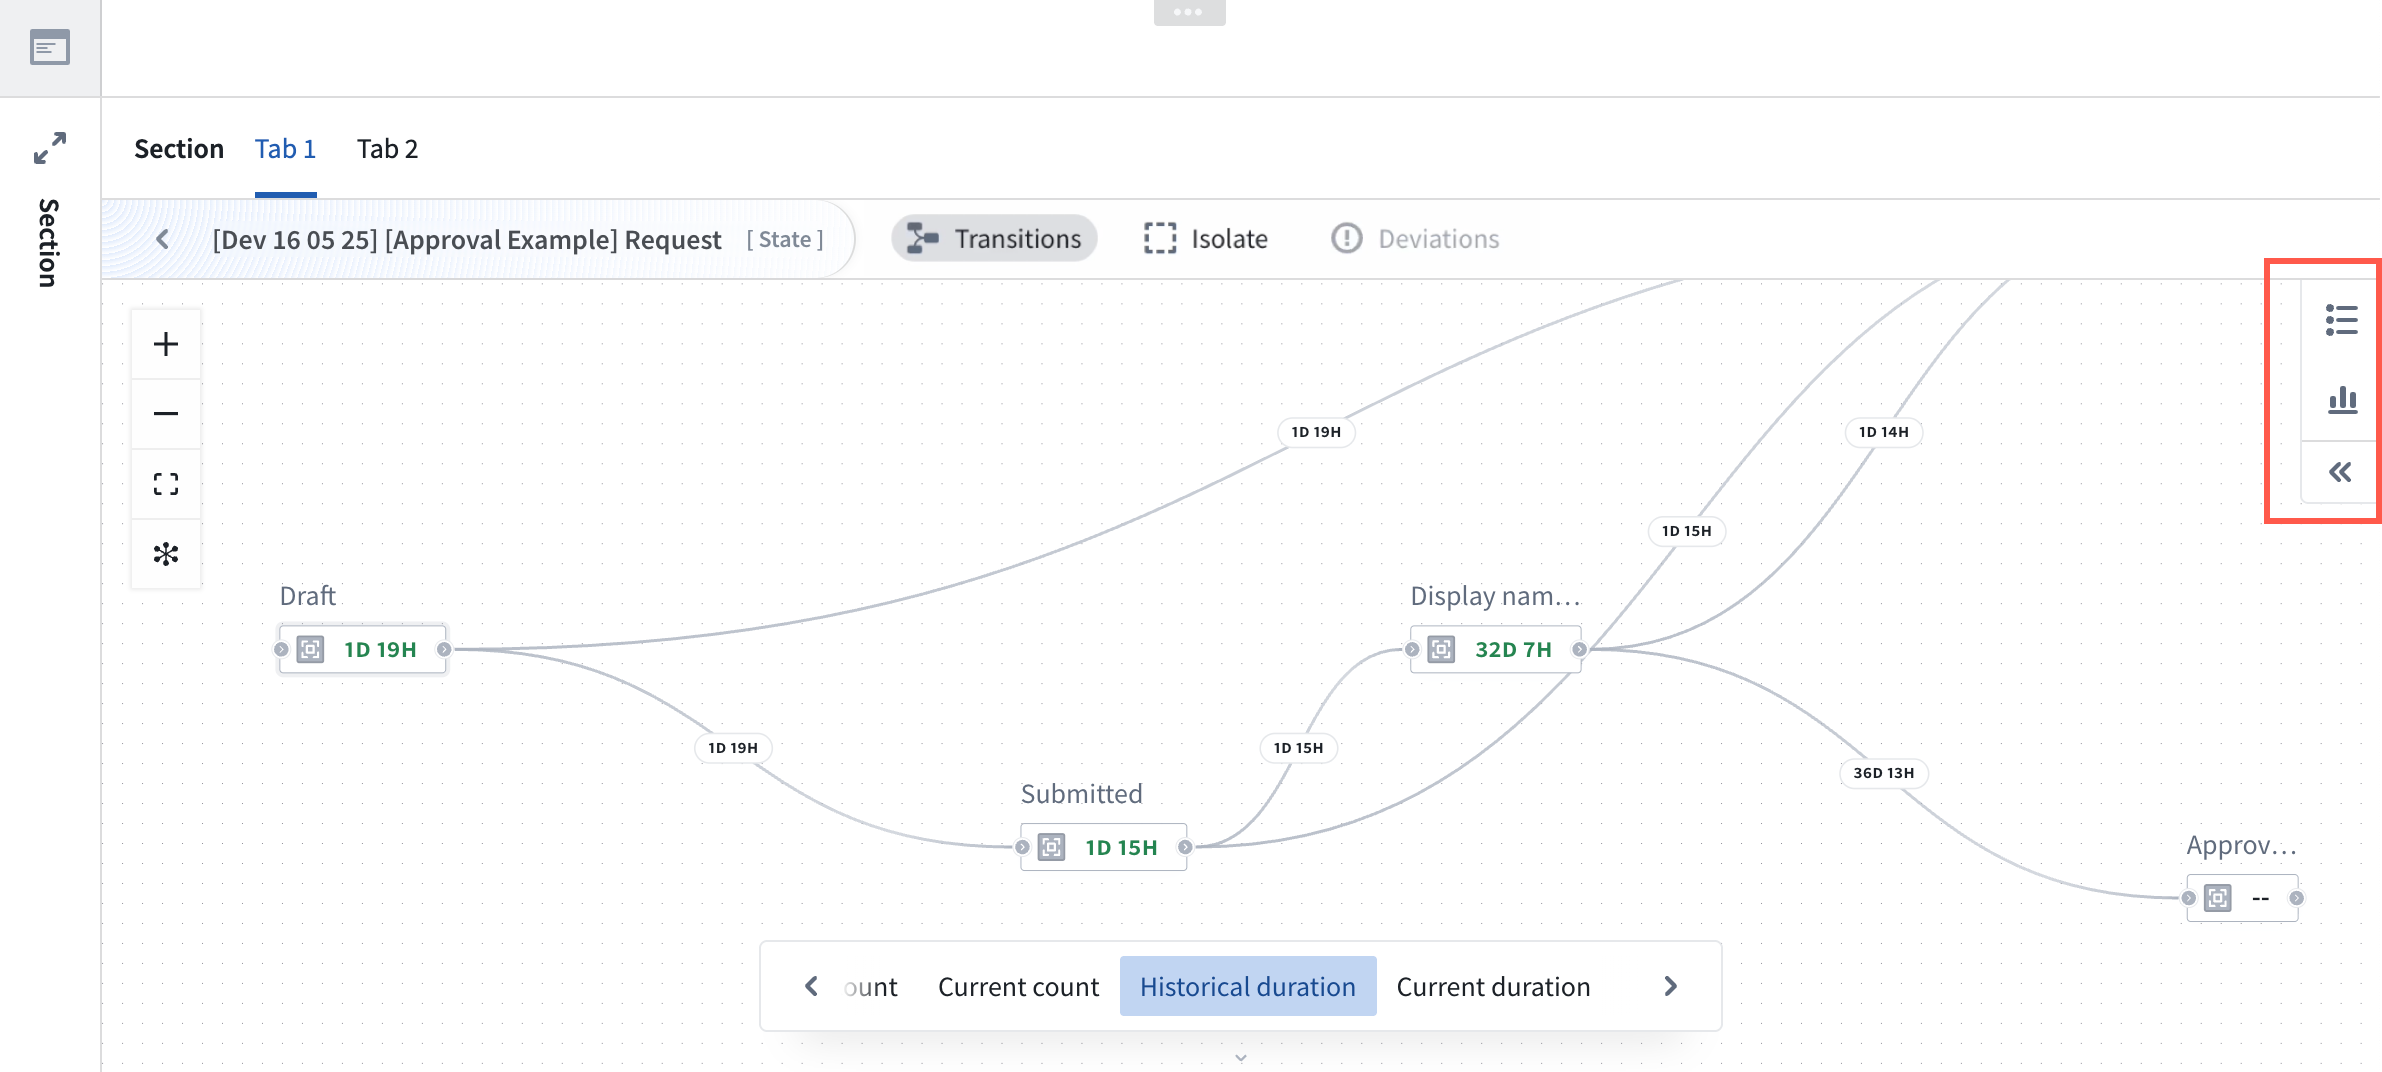
Widget features
A user viewing a graph in the Machinery widget can benefit from features including metric cycling and pinning, various usage modes, and filters.
Metric views, cycling, and pinning
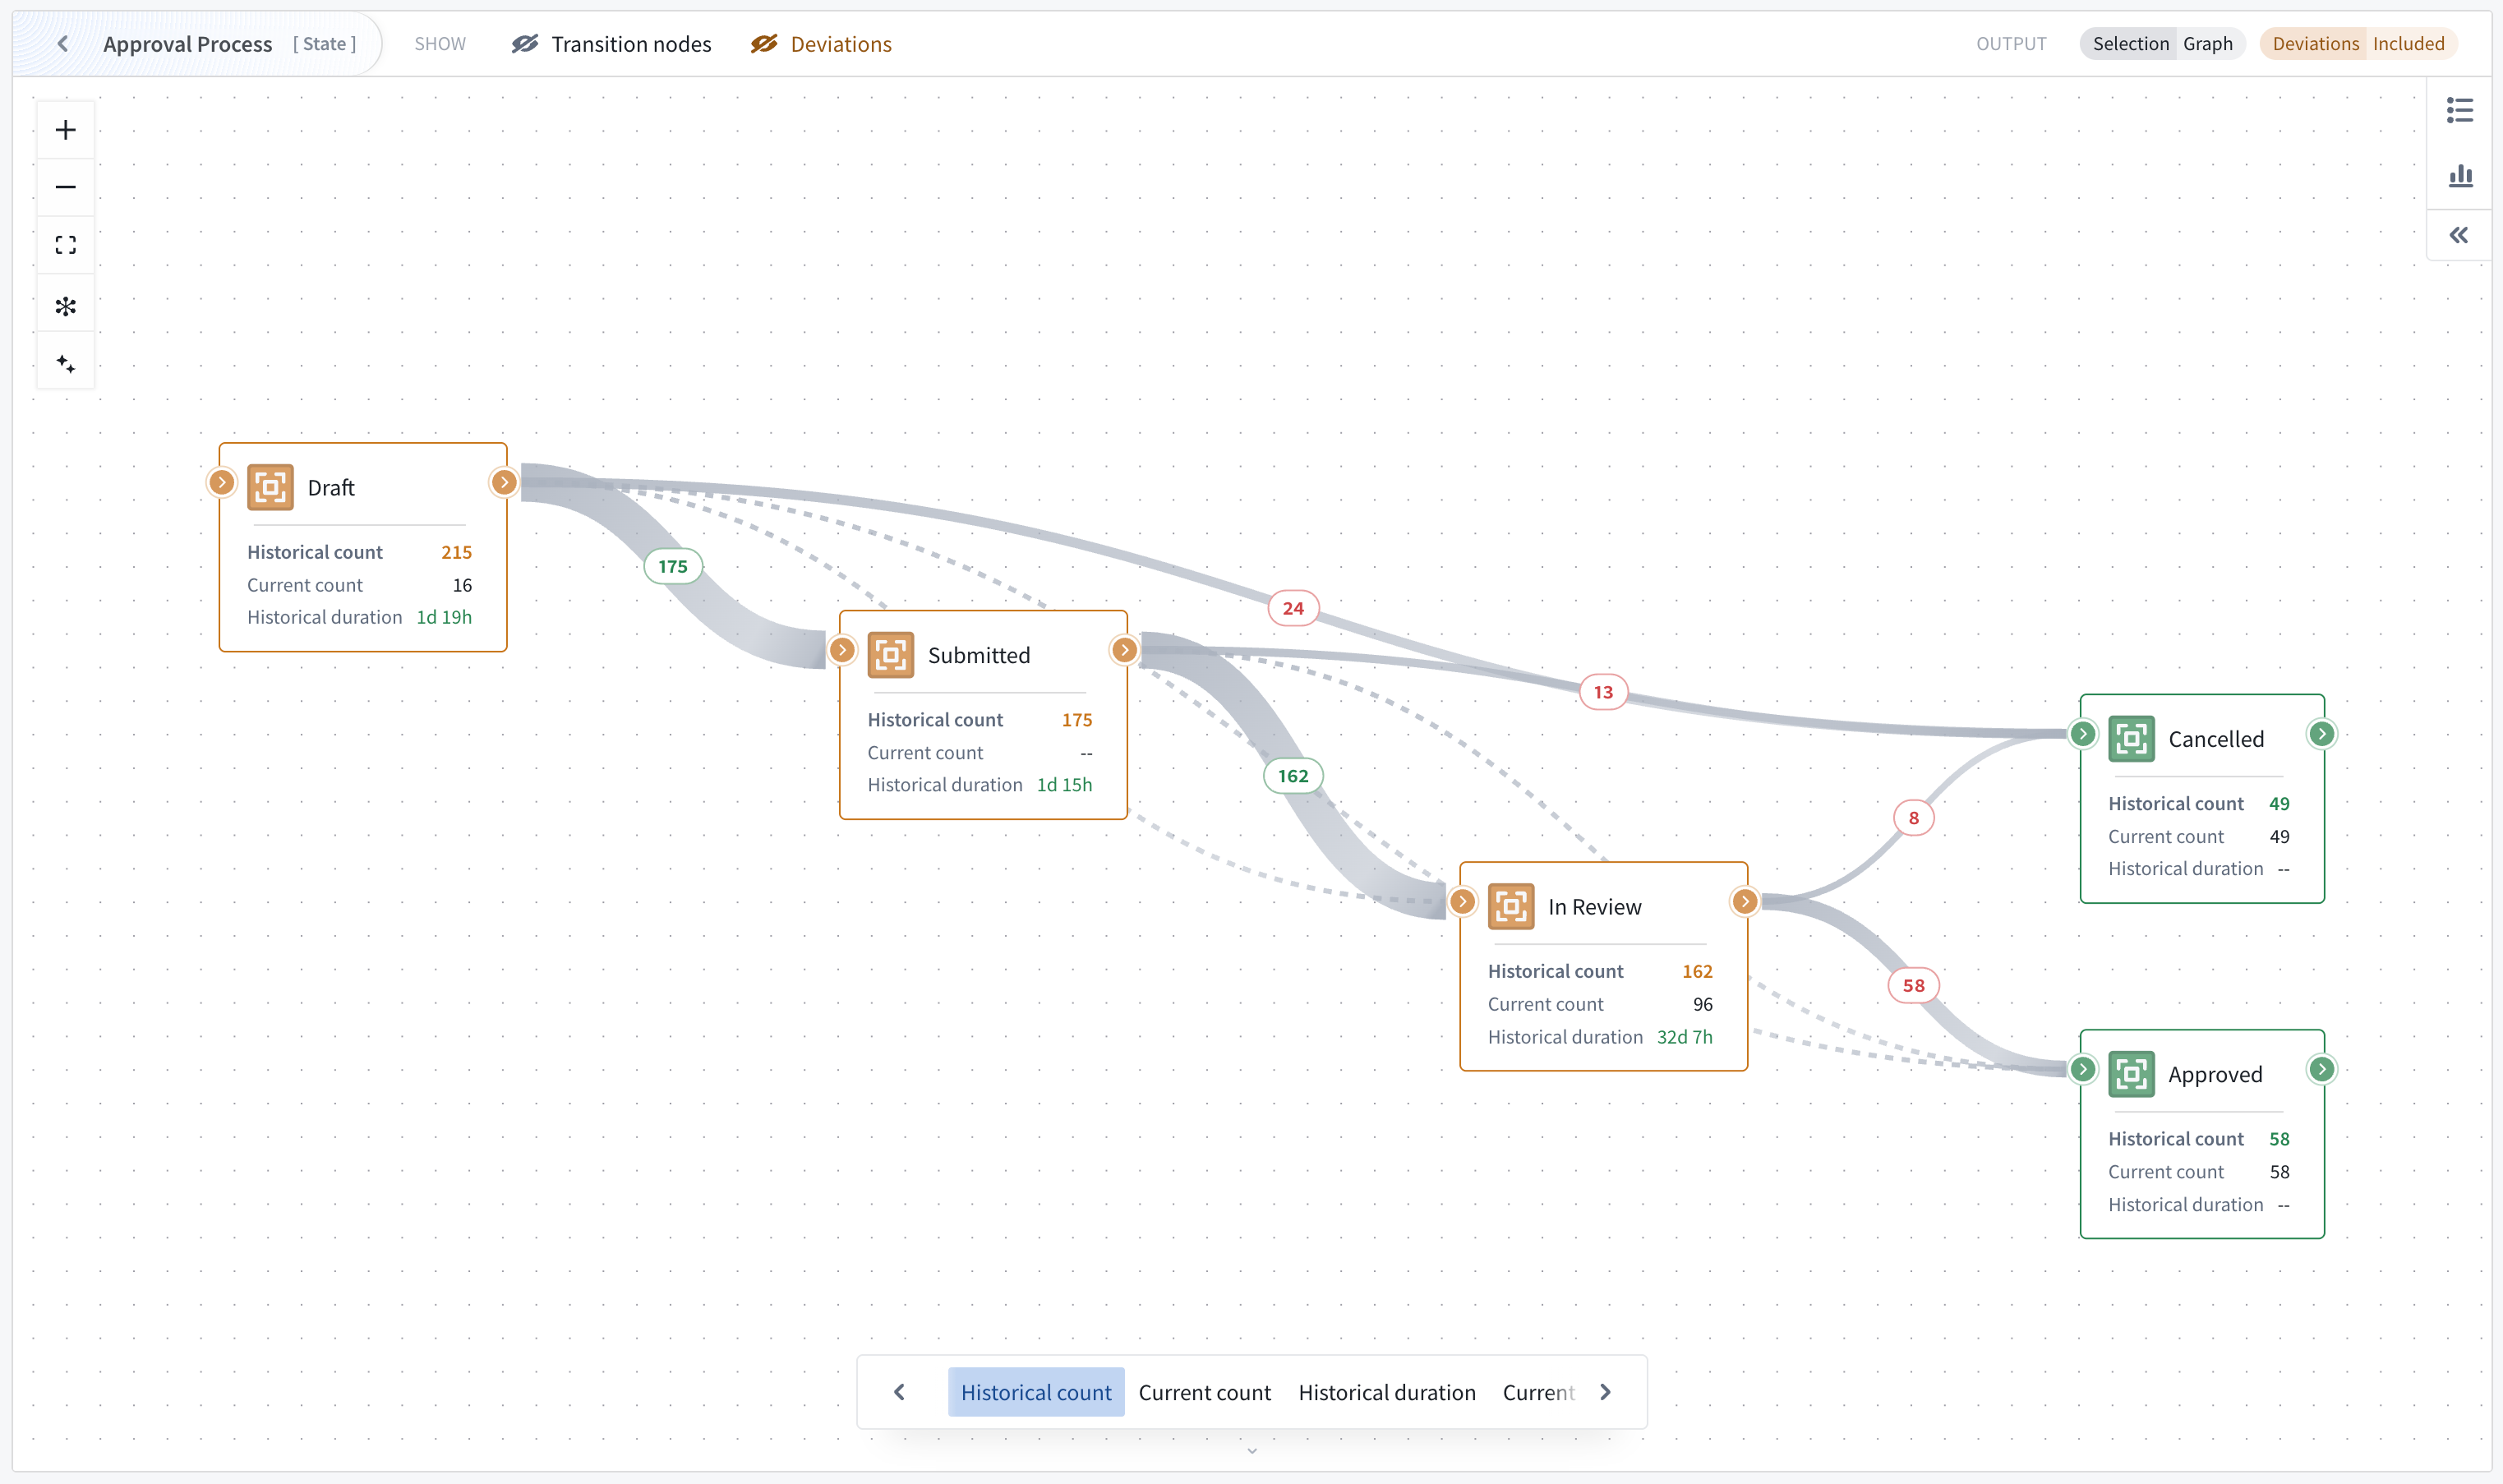
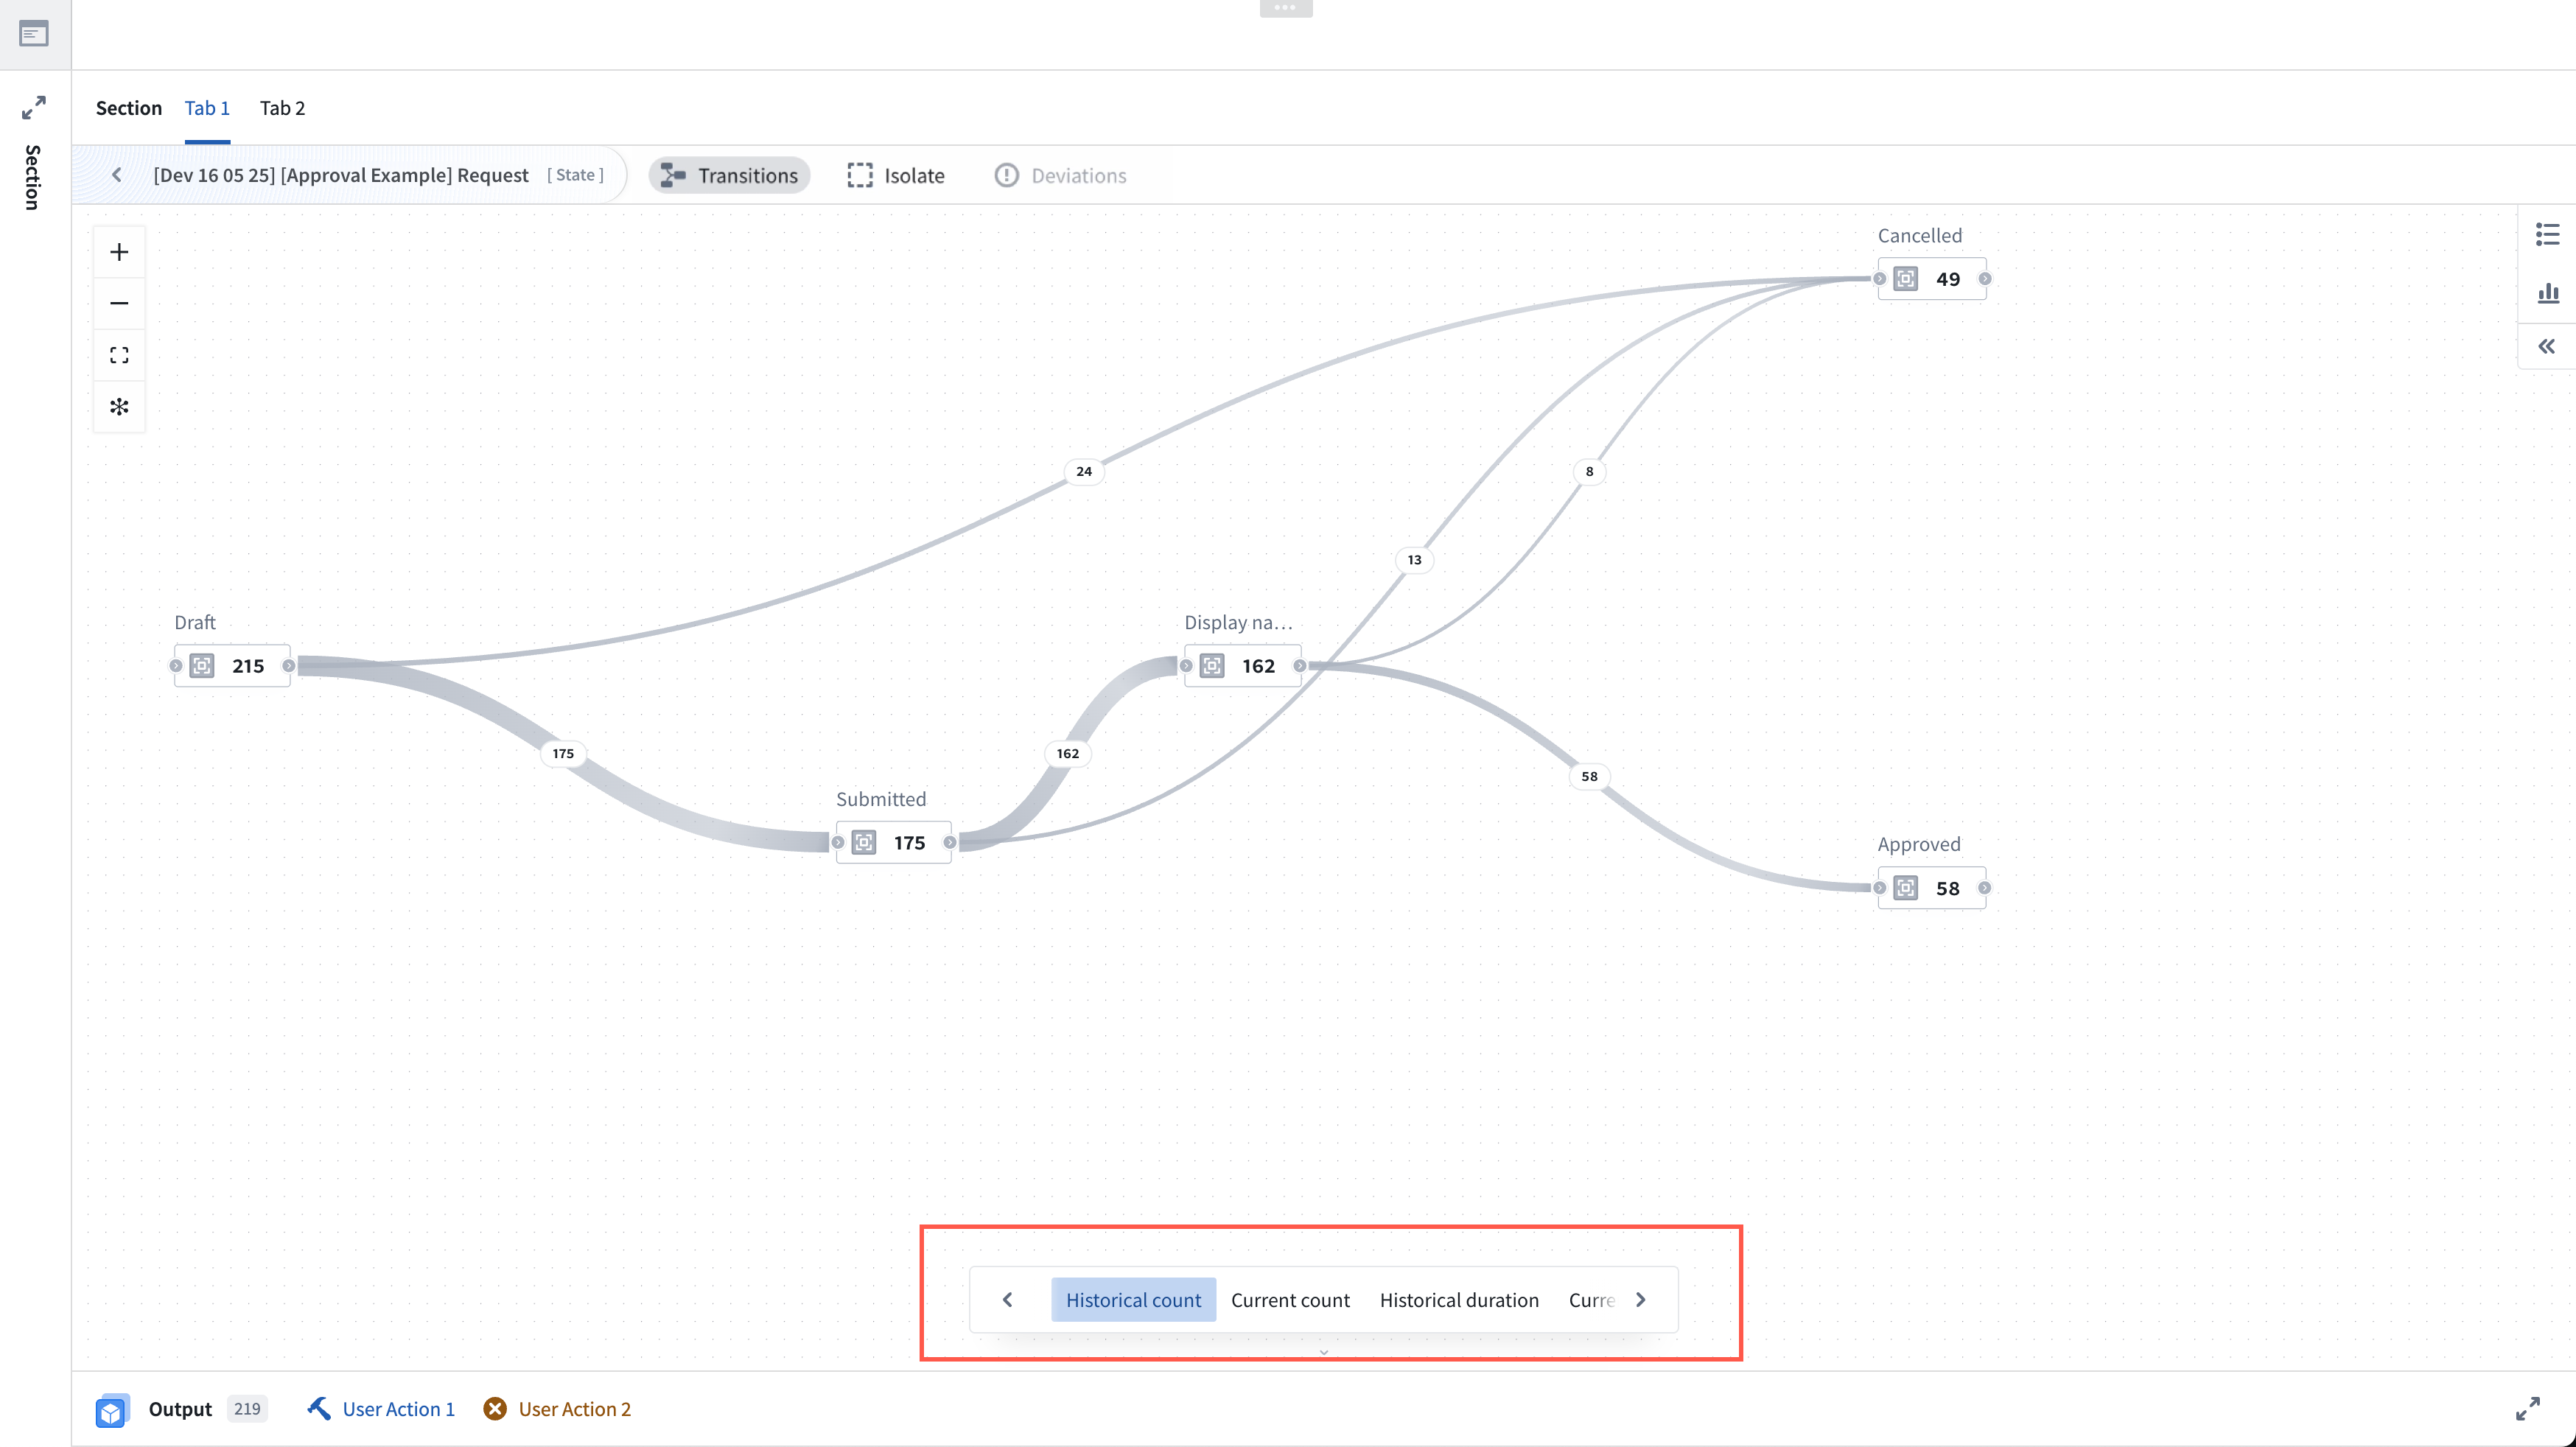
The widget displays metrics in a space-efficient manner. On the graph, one node metric is visible at a time, as well as one optional edge metric if selected. If the viewport is sufficiently zoomed in, the graph will show node cards with 3 metrics, starting with the active view. If Sankey diagram edges have been configured, edge thickness is used to represent flow frequency on the Transitions view.
Preconfigured views
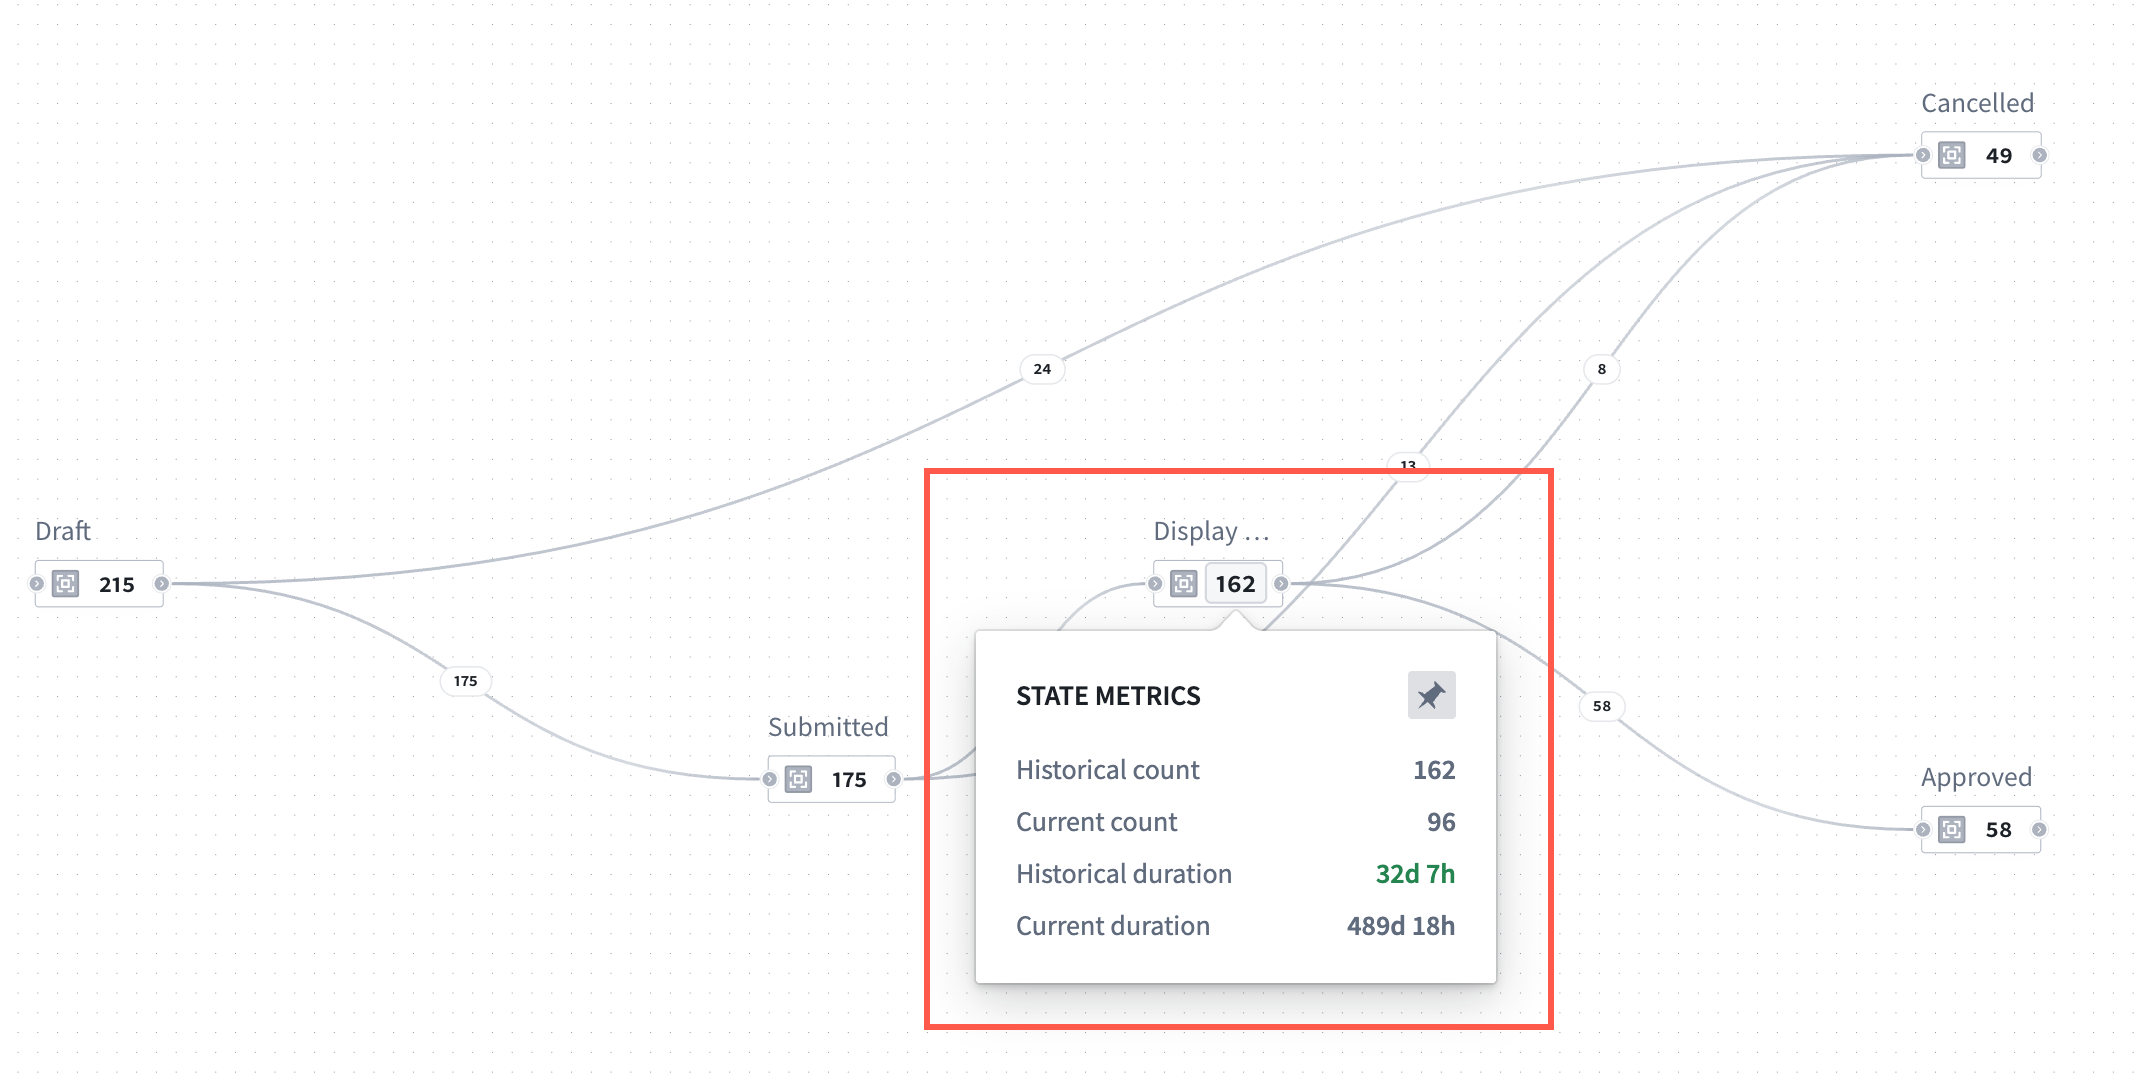
Users of the widget can cycle through preconfigured metric views, including historical count, current count, historical duration, and current duration. Once a view is selected, hover over any node to reveal all available metrics.
Additionally, select a node metric to pin it and keep the metrics visible for review, or select again to unpin.
Process-conformance filtering
By default, the widget only displays processes that conform to your process definition:
- States and transitions that are not present in Machinery are excluded.
- Metrics are computed only over conforming processes.
- If any log object type on the graph contains more than 1M objects, conformance filtering is disabled and the graph will cover all input objects including metrics computation and output object sets.
Focus into a parent process
On a graph, you may focus into a desired parent process to narrow your view.
Graph selection and outputs
Interact with the graph to filter output object sets:
- Select nodes to filter objects by state.
- Select edges to filter objects by transitions.
- Output object sets update automatically based on your selection.
Graph features
The following graph features may be enabled or disabled individually in the widget header.
- Transition nodes: When your graph includes actions or automations as configured in the Machinery application, the Machinery widget will replace them with implicit state transitions to help you understand the process from a state-transition perspective. You can choose to show the transition nodes instead, and configure default behavior in the widget configuration.
- Subprocesses: If the graph has subprocesses, you can replace these subprocesses with their implicit state transitions to allow you to see transition metrics on the currently focused process.
- Deviations: If your current data has deviating objects, they are hidden by default. Deviating objects are those that take any states or transitions that are not included in the process definition. You can make them invisible and independently choose whether they are included in the widget output.
Analysis modes
With the Machinery graph open, you can toggle between the path explorer feature and the duration distribution feature located on the right side of the graph. The selected feature will open on the right side.
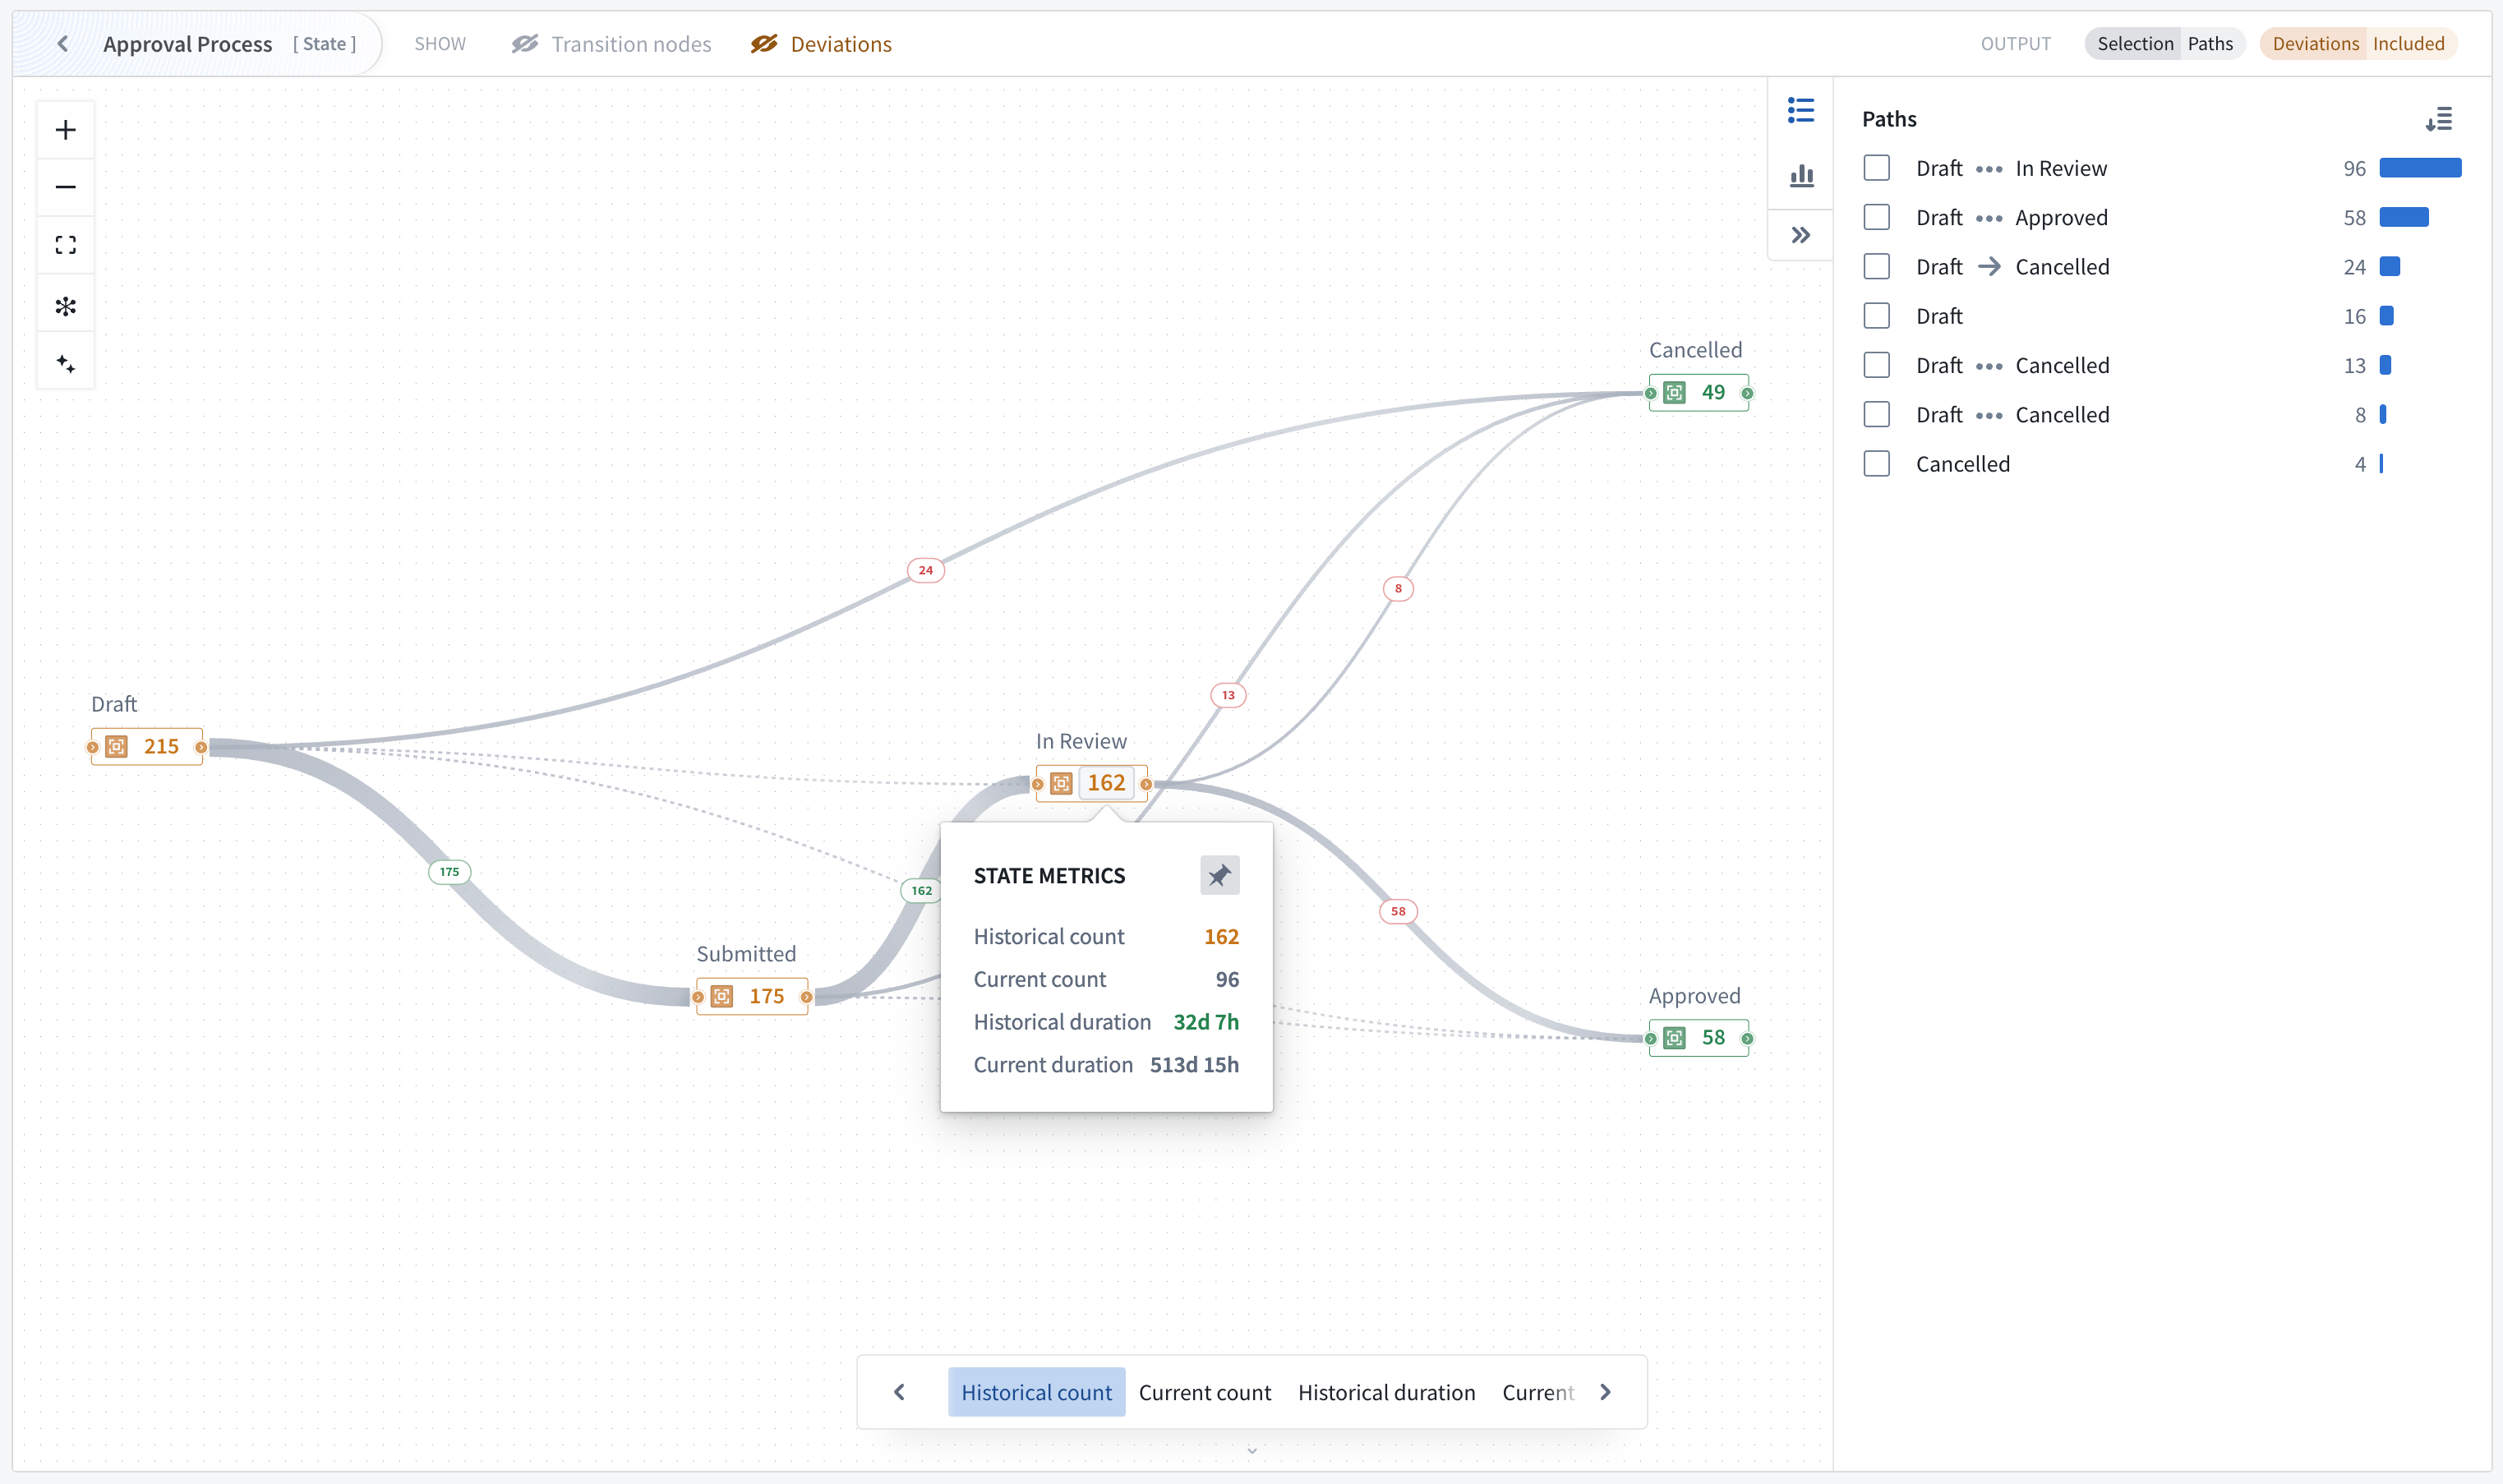
Path explorer
Analyze individual process paths and their frequency using the path explorer feature for one process at a time. To open path explorer, select the path explorer icon located on the right side of the graph.
Path explorer displays all paths taken by the currently focused process, and shows the path frequency distribution (the frequency of objects completing the path).
Hover over a path in the window to see it highlighted on your graph. You may also select one or more paths to filter the output.
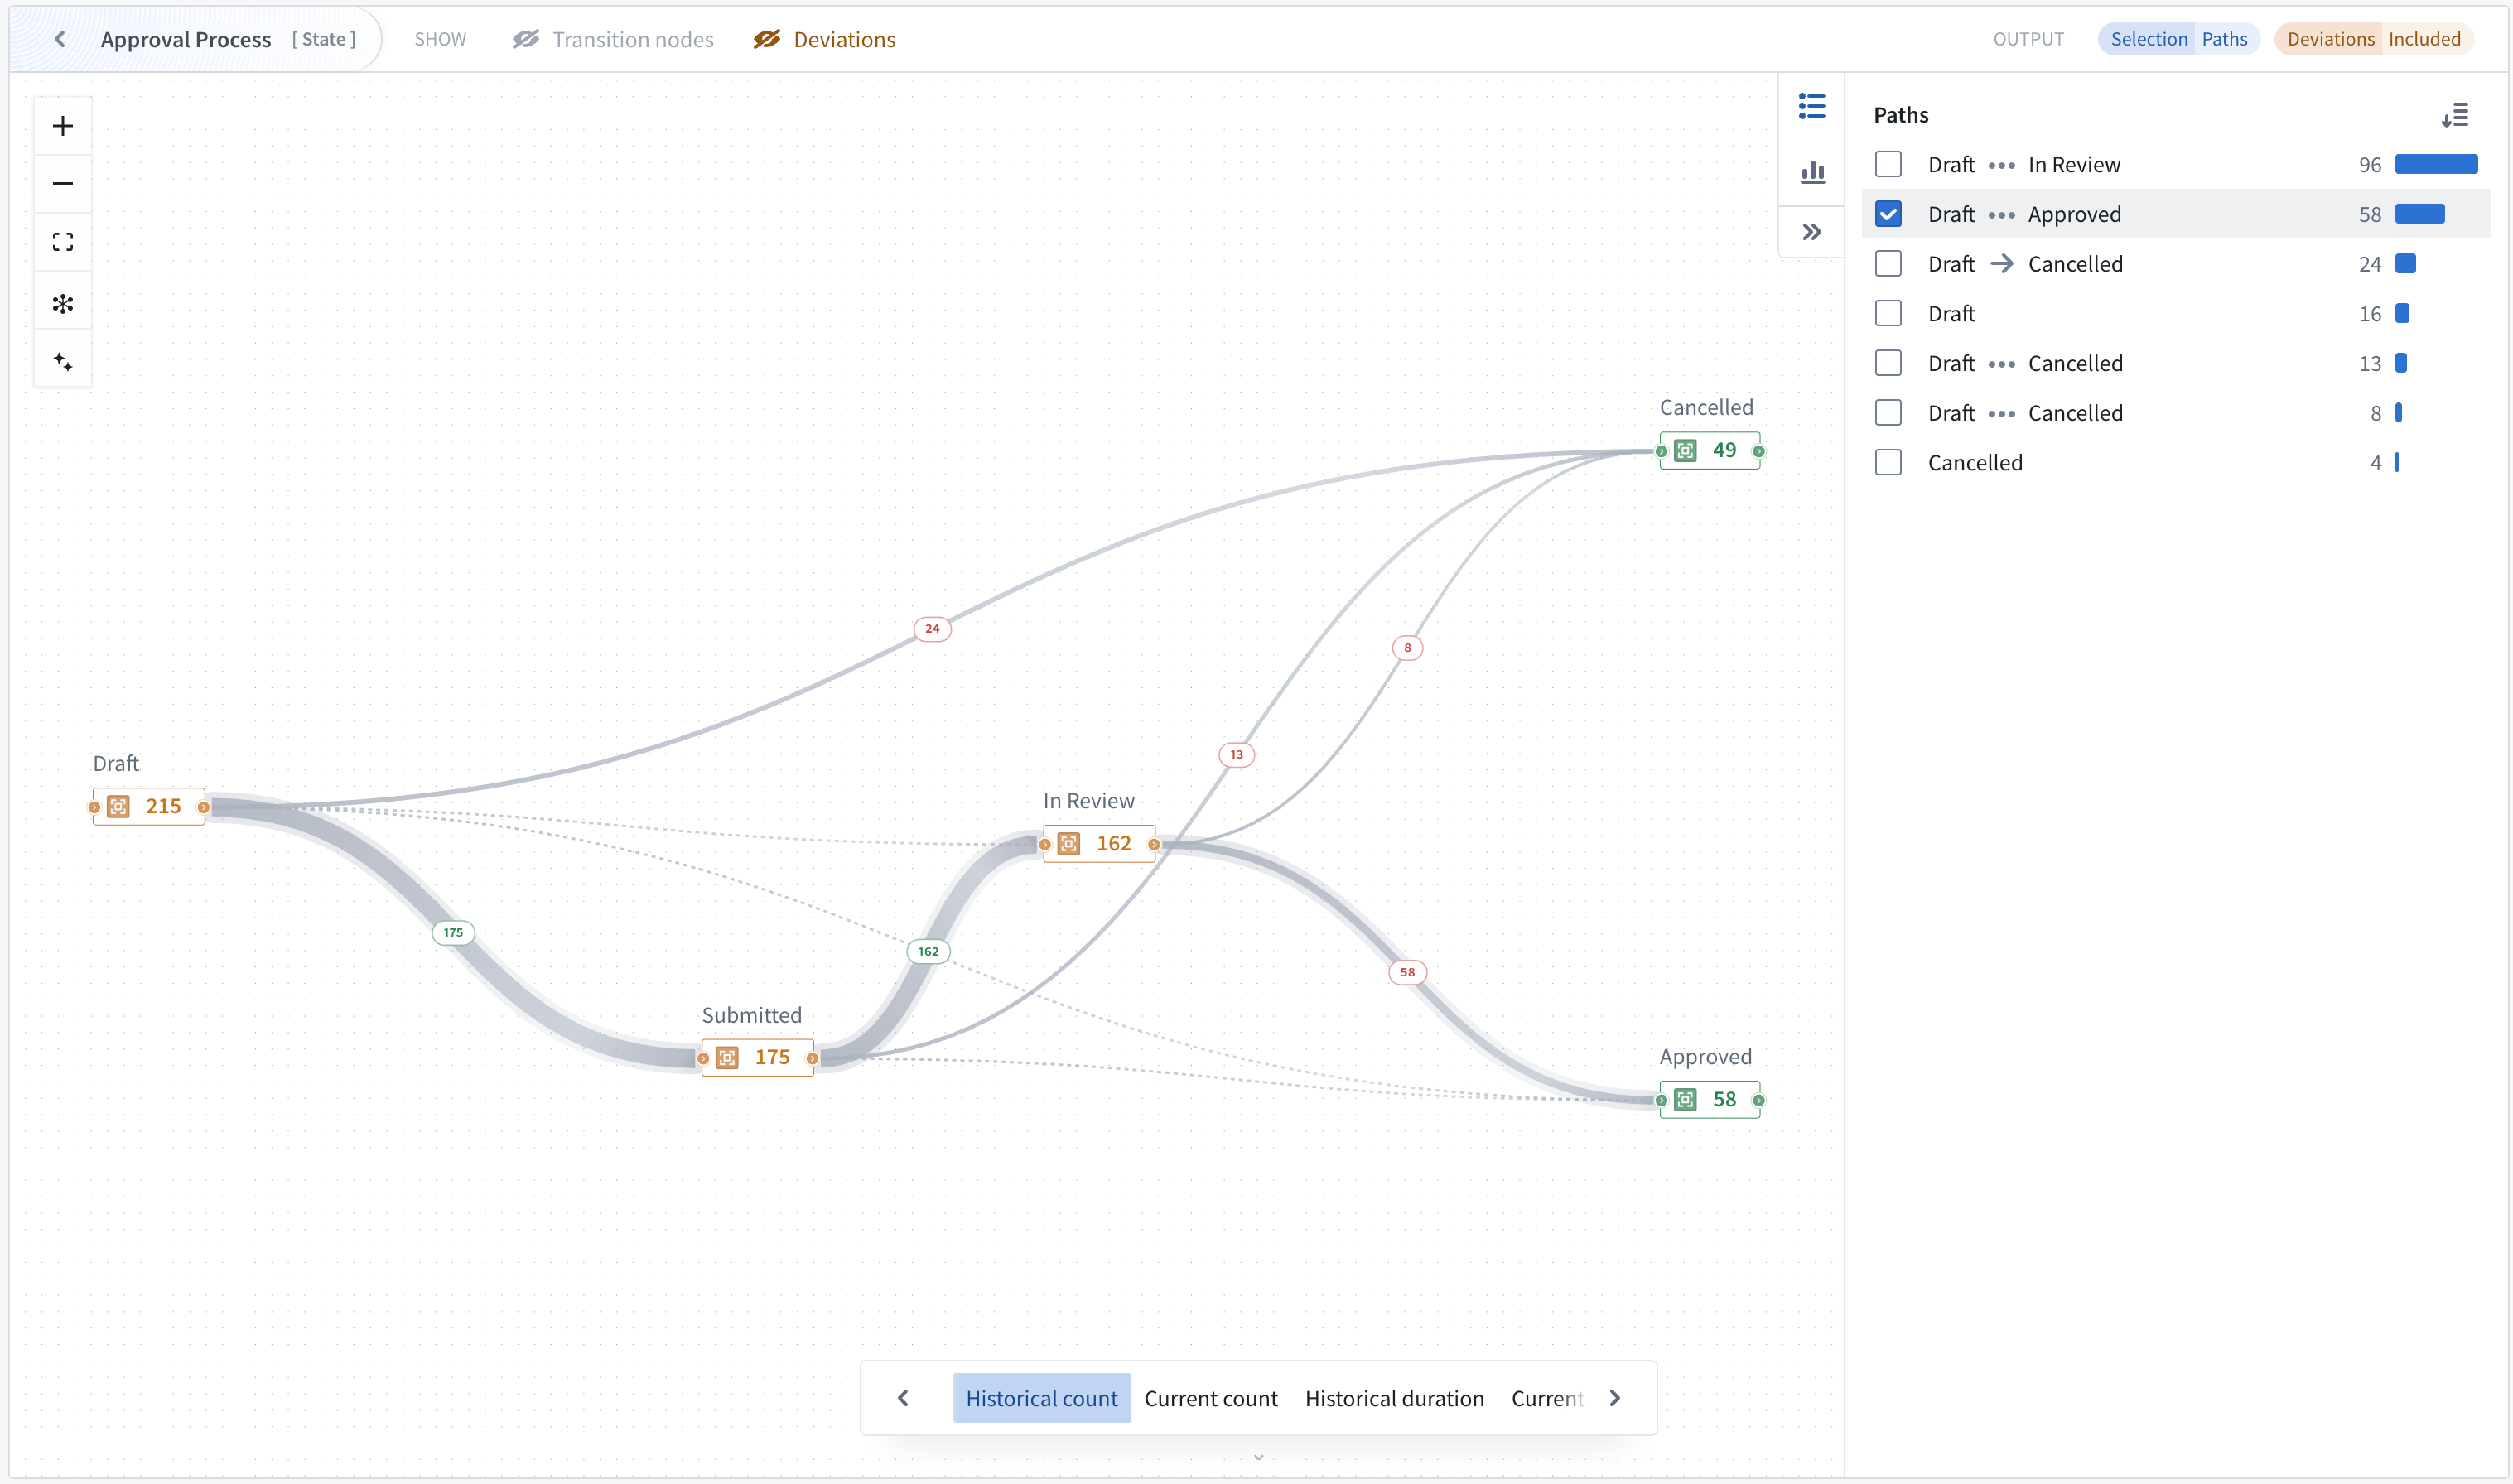
Note that when path explorer is open, path selection controls the widget output and overrides previous node/edge selection.
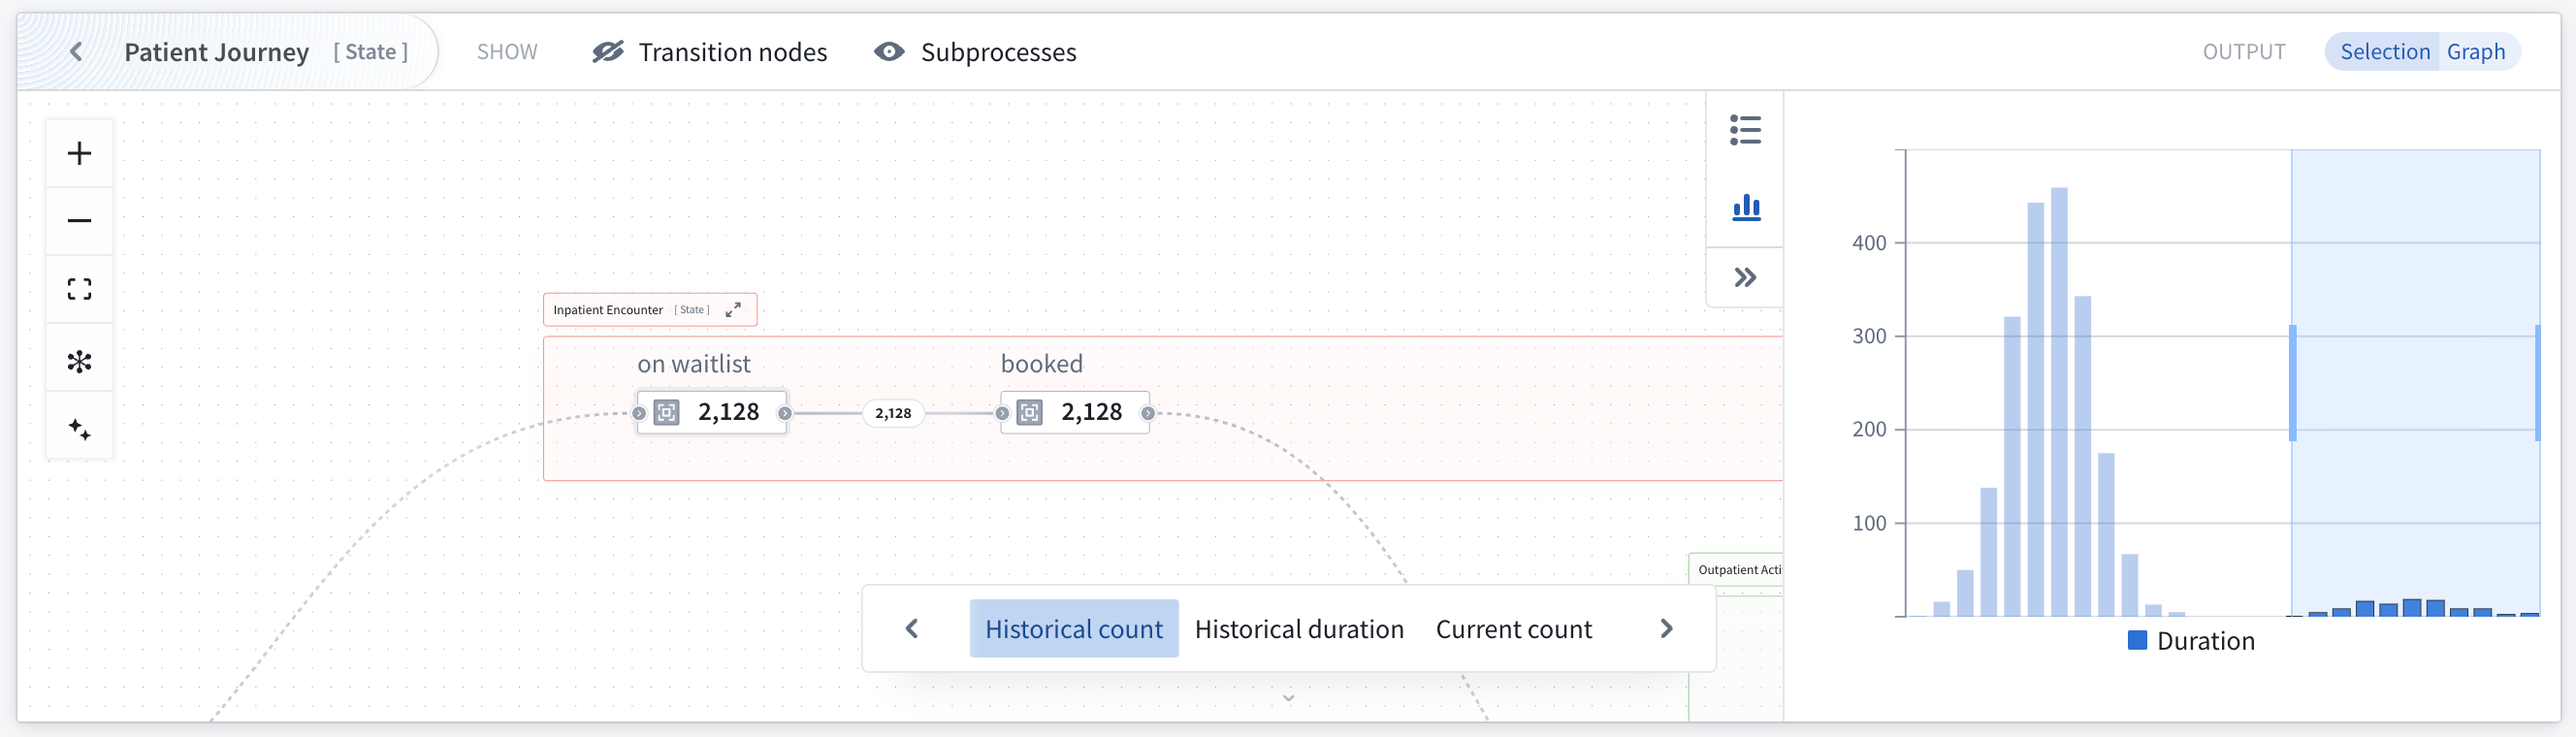
Duration distribution
Use the duration distribution filter to identify performance outliers and analyze time spent in states.
The duration chart responds to selection on the graph and follows configured node and edge selection options.
Selecting individual buckets or a range of buckets will filter the output object set. You can combine chart selection with graph selection to find objects with undesirable behavior, such as taking too long in an individual transition or state.
中文翻译
分析与监控流程
Machinery 小组件可为您配置的 Machinery 流程提供运营洞察与监控能力。
- 当用户正在流程中活跃操作时,可清晰掌握流程运行状况。
- 识别分析及监控工作流中的瓶颈环节。
- 通过可配置视图可视化流程流转与指标数据。
该组件可在 Workshop 应用中渲染您的 Machinery 图谱,以可视化形式展示指标、流程流转及对象分布。
Machinery 小组件可在 Workshop 模块中使用,也可在 Machinery 应用中作为独立视图模式使用(功能有限)。
组件配置
创建或打开 Workshop 模块,选择 Machinery Overview 组件。默认选中组件 v2 版本,支持 Machinery v2 资源。在组件配置顶部,选择您的 Machinery 图谱资源。
升级现有应用
新建的 Machinery 组件将默认创建为 v2 组件。现有组件需升级至 v2 版本。
- 要升级旧版组件至 v2,请通过 ... 下拉菜单打开 Workshop 编辑模式。
- 在图谱任意位置点击,在 组件设置 菜单中选择 使用 Machinery v2。
- 相应更新您的输入配置。
输入
为图谱中的每个根流程配置一个输入对象集。Machinery 组件会根据链接类型设置自动推导子流程对象集,子流程通过 对象类型 中配置的链接类型关联至其父对象。
示例: 若您提供 100 个应用对象,每个应用关联多个审核对象,组件将通过已配置的链接类型自动识别所有相关审核。这意味着您只需为图谱的每个根流程配置对象输入(通常为 1 个对象输入)。
指标视图
Machinery 组件预置以下指标视图:
- 历史计数: 显示累计计数指标。
- 当前计数: 显示当前状态计数。
- 历史时长: 显示历史状态停留时长。
- 当前时长: 显示当前状态停留时长。
应用构建者可添加、移除、重新排序或自定义这些指标视图。
也可通过 + 添加项目 选项添加自定义视图。对于每个视图,构建者可定义一个节点指标(含数字格式与条件着色)、一个可选边指标,并启用桑基图边厚度设置。
输出
输出数据集可用于 Workshop 模块内的进一步分析。配置输出对象集以捕获基于图谱交互的筛选结果:
- 为图谱中的每个流程创建一个输出(可选)
- 输出对象集应用 Machinery 应用中流程级别定义的筛选条件,以及父流程到子流程的搜索关联
- 输出动态响应节点/边选择
- 路径探索器和分布图提供影响输出的额外方式
节点与边选择
您可通过切换以下选项,改变节点选择对对象输出的影响方式:
- 当前处于选定状态的流程
- 曾处于选定状态的流程
边选择可配置为显示曾经历某次转换的对象,或仅显示最近一次转换。
配置视图
视图决定组件中显示的指标与可视化内容。详情请参见下方指标视图章节。
组件功能
用户在 Machinery 组件中查看图谱时,可享受指标循环与固定、多种使用模式及筛选器等特性。
指标视图、循环与固定
组件以空间高效方式显示指标。图谱上每次仅显示一个节点指标,若已选择则同时显示一个可选边指标。当视口缩放至足够大时,图谱将显示包含 3 个指标的节点卡片(从当前活动视图开始)。若已配置桑基图边,边厚度用于在"转换"视图中表示流转频率。
预配置视图
组件用户可循环切换预配置的指标视图,包括历史计数、当前计数、历史时长和当前时长。选定视图后,悬停任意节点即可查看所有可用指标。
此外,可选择节点指标将其固定,保持指标可见以供查看;再次点击可取消固定。
流程合规性筛选
默认情况下,组件仅显示符合流程定义的流程:
- 排除 Machinery 中不存在的状态和转换。
- 指标仅基于合规流程计算。
- 若图谱中任一日志对象类型包含超过 100 万个对象,合规性筛选将被禁用,图谱将覆盖所有输入对象(含指标计算与输出对象集)。
聚焦父流程
在图谱中,您可聚焦至所需父流程以缩小视图范围。
图谱选择与输出
与图谱交互以筛选输出对象集:
- 选择节点按状态筛选对象。
- 选择边按转换筛选对象。
- 输出对象集根据选择自动更新。
图谱功能
以下图谱功能可在组件标题中单独启用或禁用。
- 转换节点: 当图谱包含 Machinery 应用中配置的操作或自动化时,Machinery 组件将用隐式状态转换替代它们,帮助您从状态转换角度理解流程。您可选择显示转换节点,并在组件配置中配置默认行为。
- 子流程: 若图谱包含子流程,您可用隐式状态转换替代这些子流程,从而查看当前聚焦流程的转换指标。
- 偏差: 若当前数据存在偏差对象,默认隐藏。偏差对象指包含流程定义中未包含的状态或转换的对象。您可使其不可见,并独立选择是否将其纳入组件输出。
分析模式
打开 Machinery 图谱后,您可在图谱右侧的路径探索器功能和时长分布功能之间切换。所选功能将在右侧打开。
路径探索器
使用路径探索器功能一次分析一个流程的个体路径及其频率。要打开路径探索器,请选择图谱右侧的路径探索器图标。
路径探索器显示当前聚焦流程的所有路径,并展示路径频率分布(完成路径的对象频率)。
在窗口中悬停某条路径,可看到该路径在图谱上高亮显示。您也可选择一条或多条路径以筛选输出。
请注意,当路径探索器打开时,路径选择将控制组件输出,并覆盖之前的节点/边选择。
时长分布
使用时长分布筛选器识别性能异常值,分析在状态中停留的时间。
时长图表响应图谱上的选择,并遵循已配置的节点和边选择选项。
选择单个桶或桶范围将筛选输出对象集。您可将图表选择与图谱选择结合,查找具有不良行为的对象,例如在单个转换或状态中耗时过长。